Week 05
Half way into term 01! This week, I worked on my data story, about plastics in the ocean. We presented our process, visualisation and stories.
I examined plastics in the ocean as measured by two different dives: the deep sea debris database and MBARI. Every second, about 500 pounds of plastic enters the ocean, and this was the story angle I was going with.
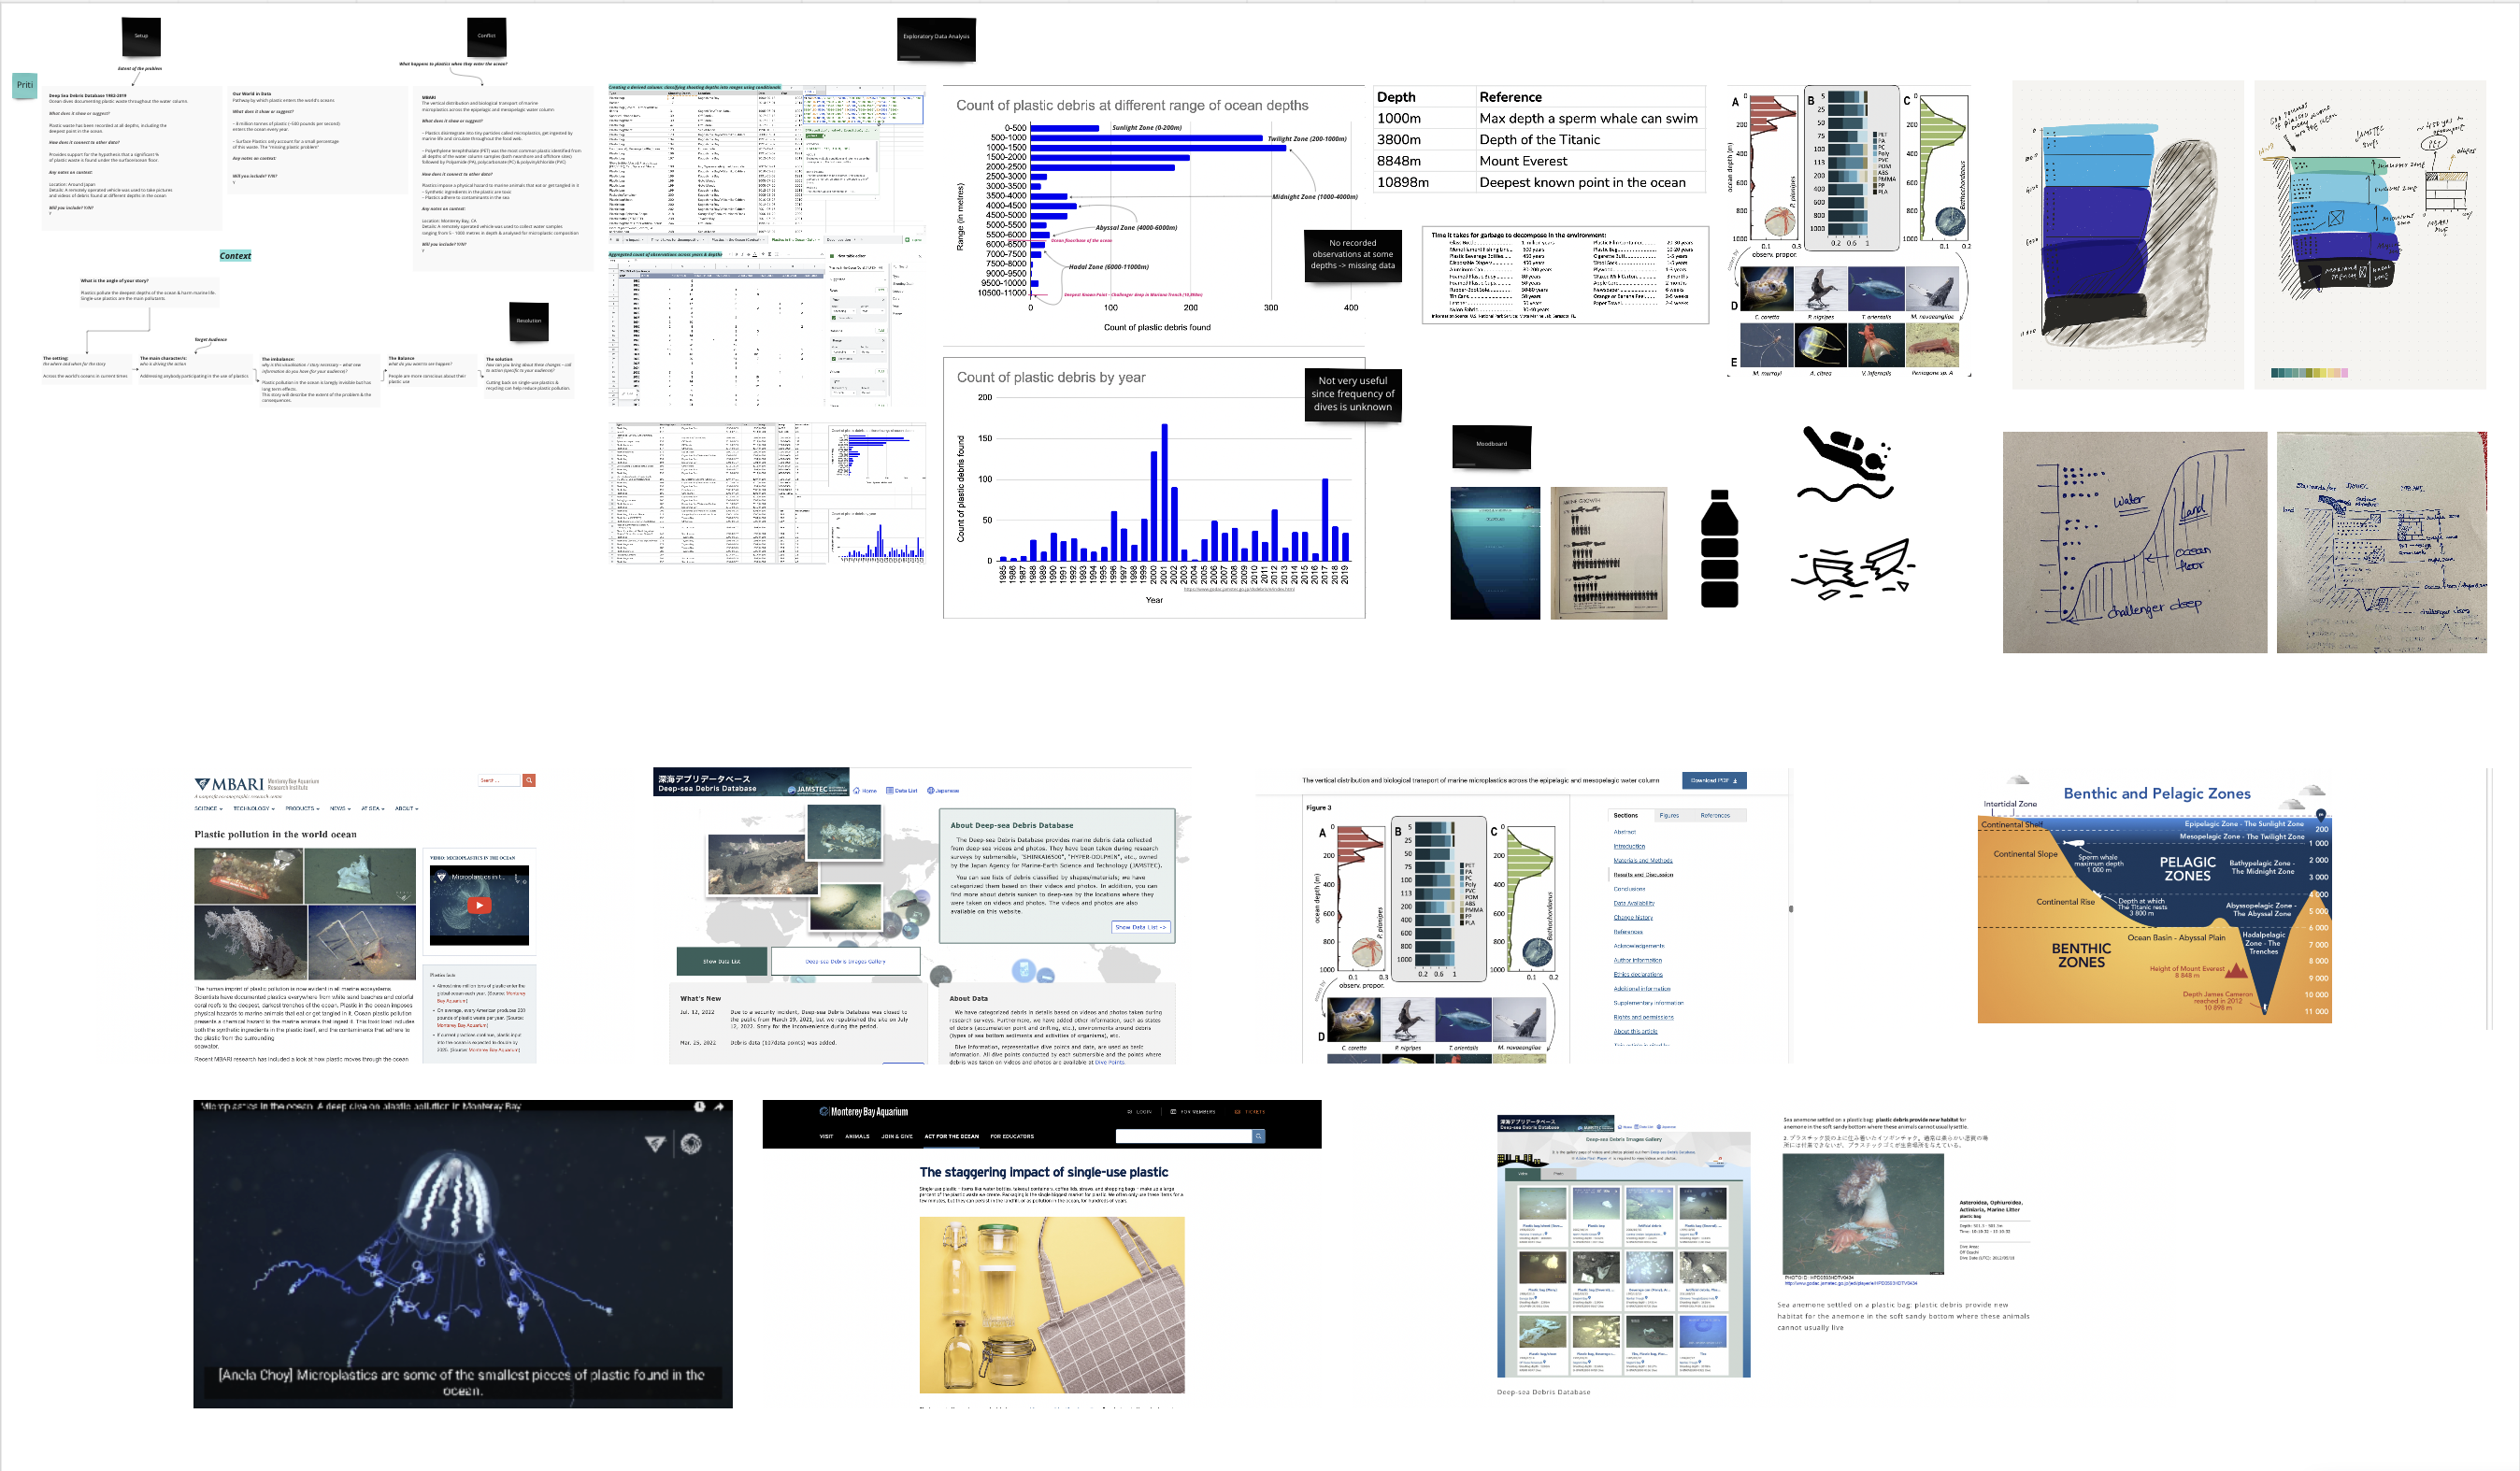
To compare the depths at which plastics have been recorded, I used realistic measures as a reference for my audience.

I created an infographic to show how deep our plastics are and the impact it has on marine life.

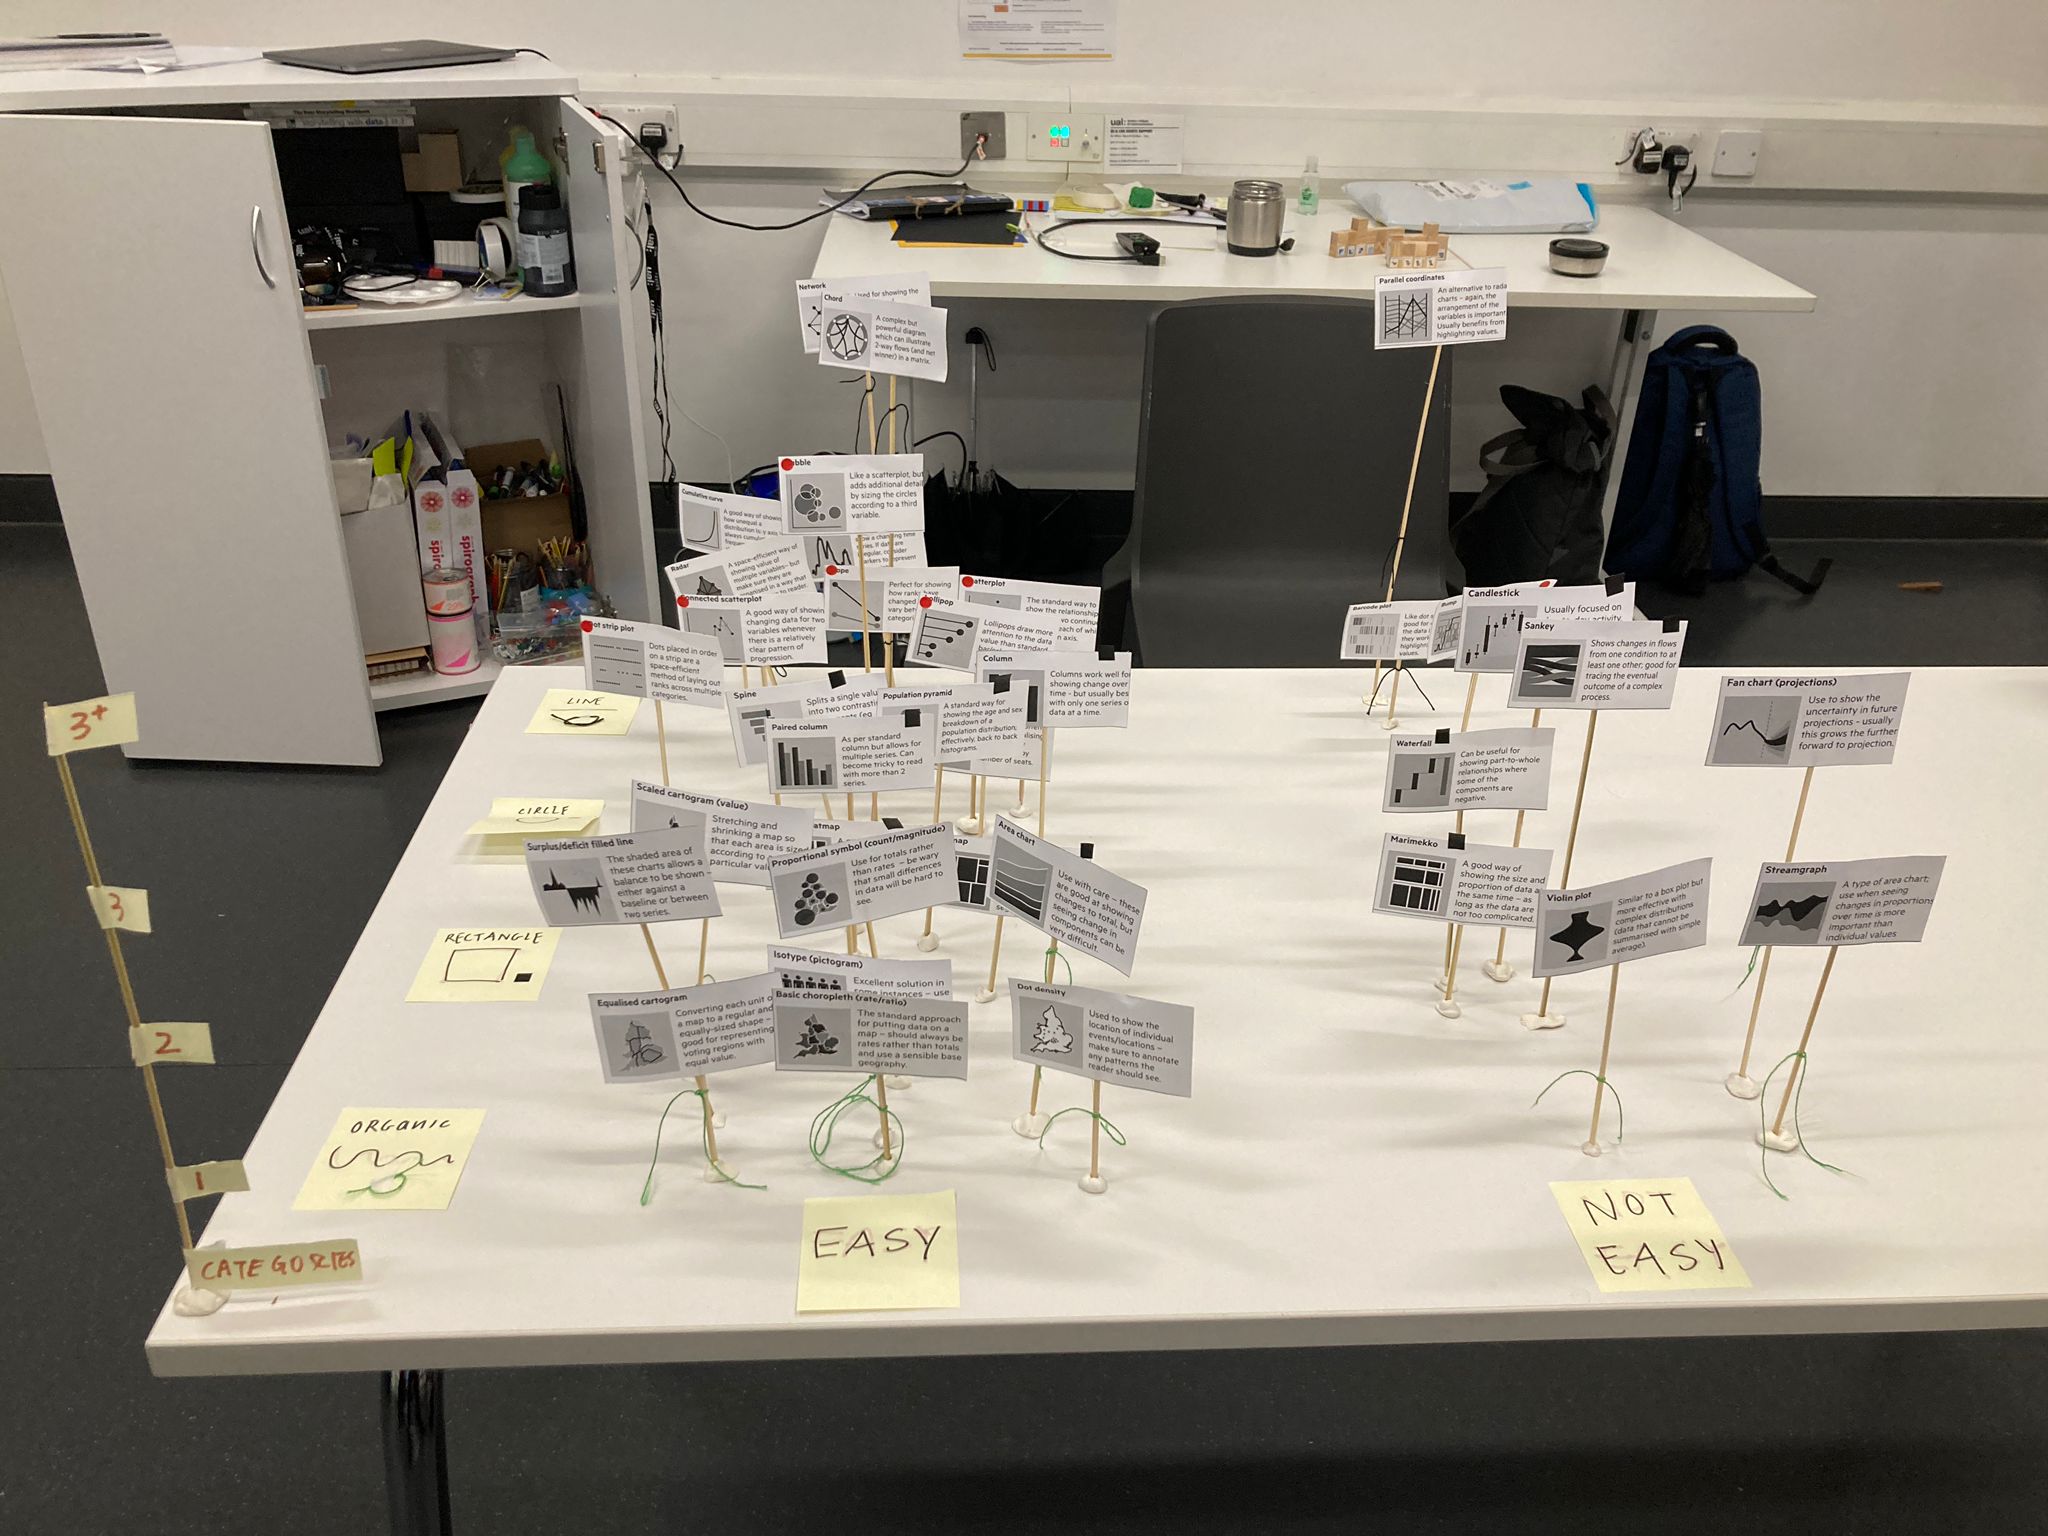
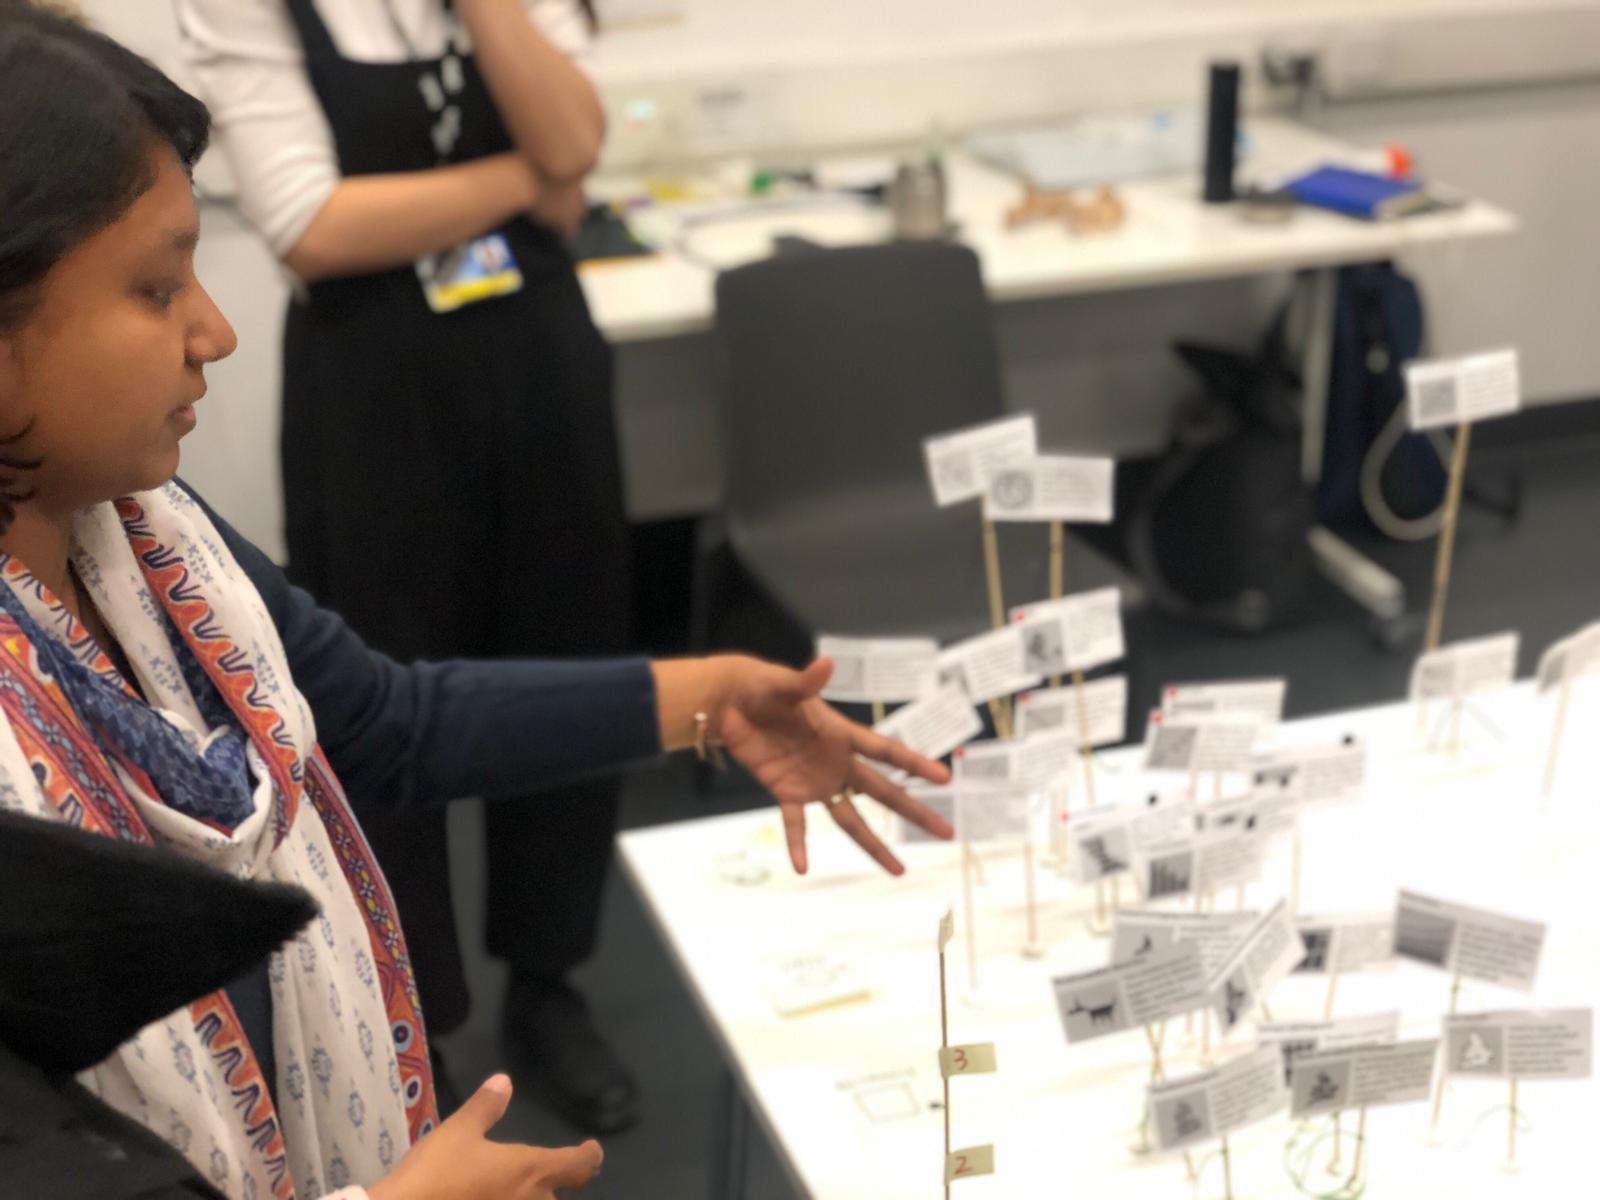
We also explored representation and developing a mental index of chart types. In groups we created physical structures to categorise chart types based on their accessibility, number of variables and underlying shapes used.
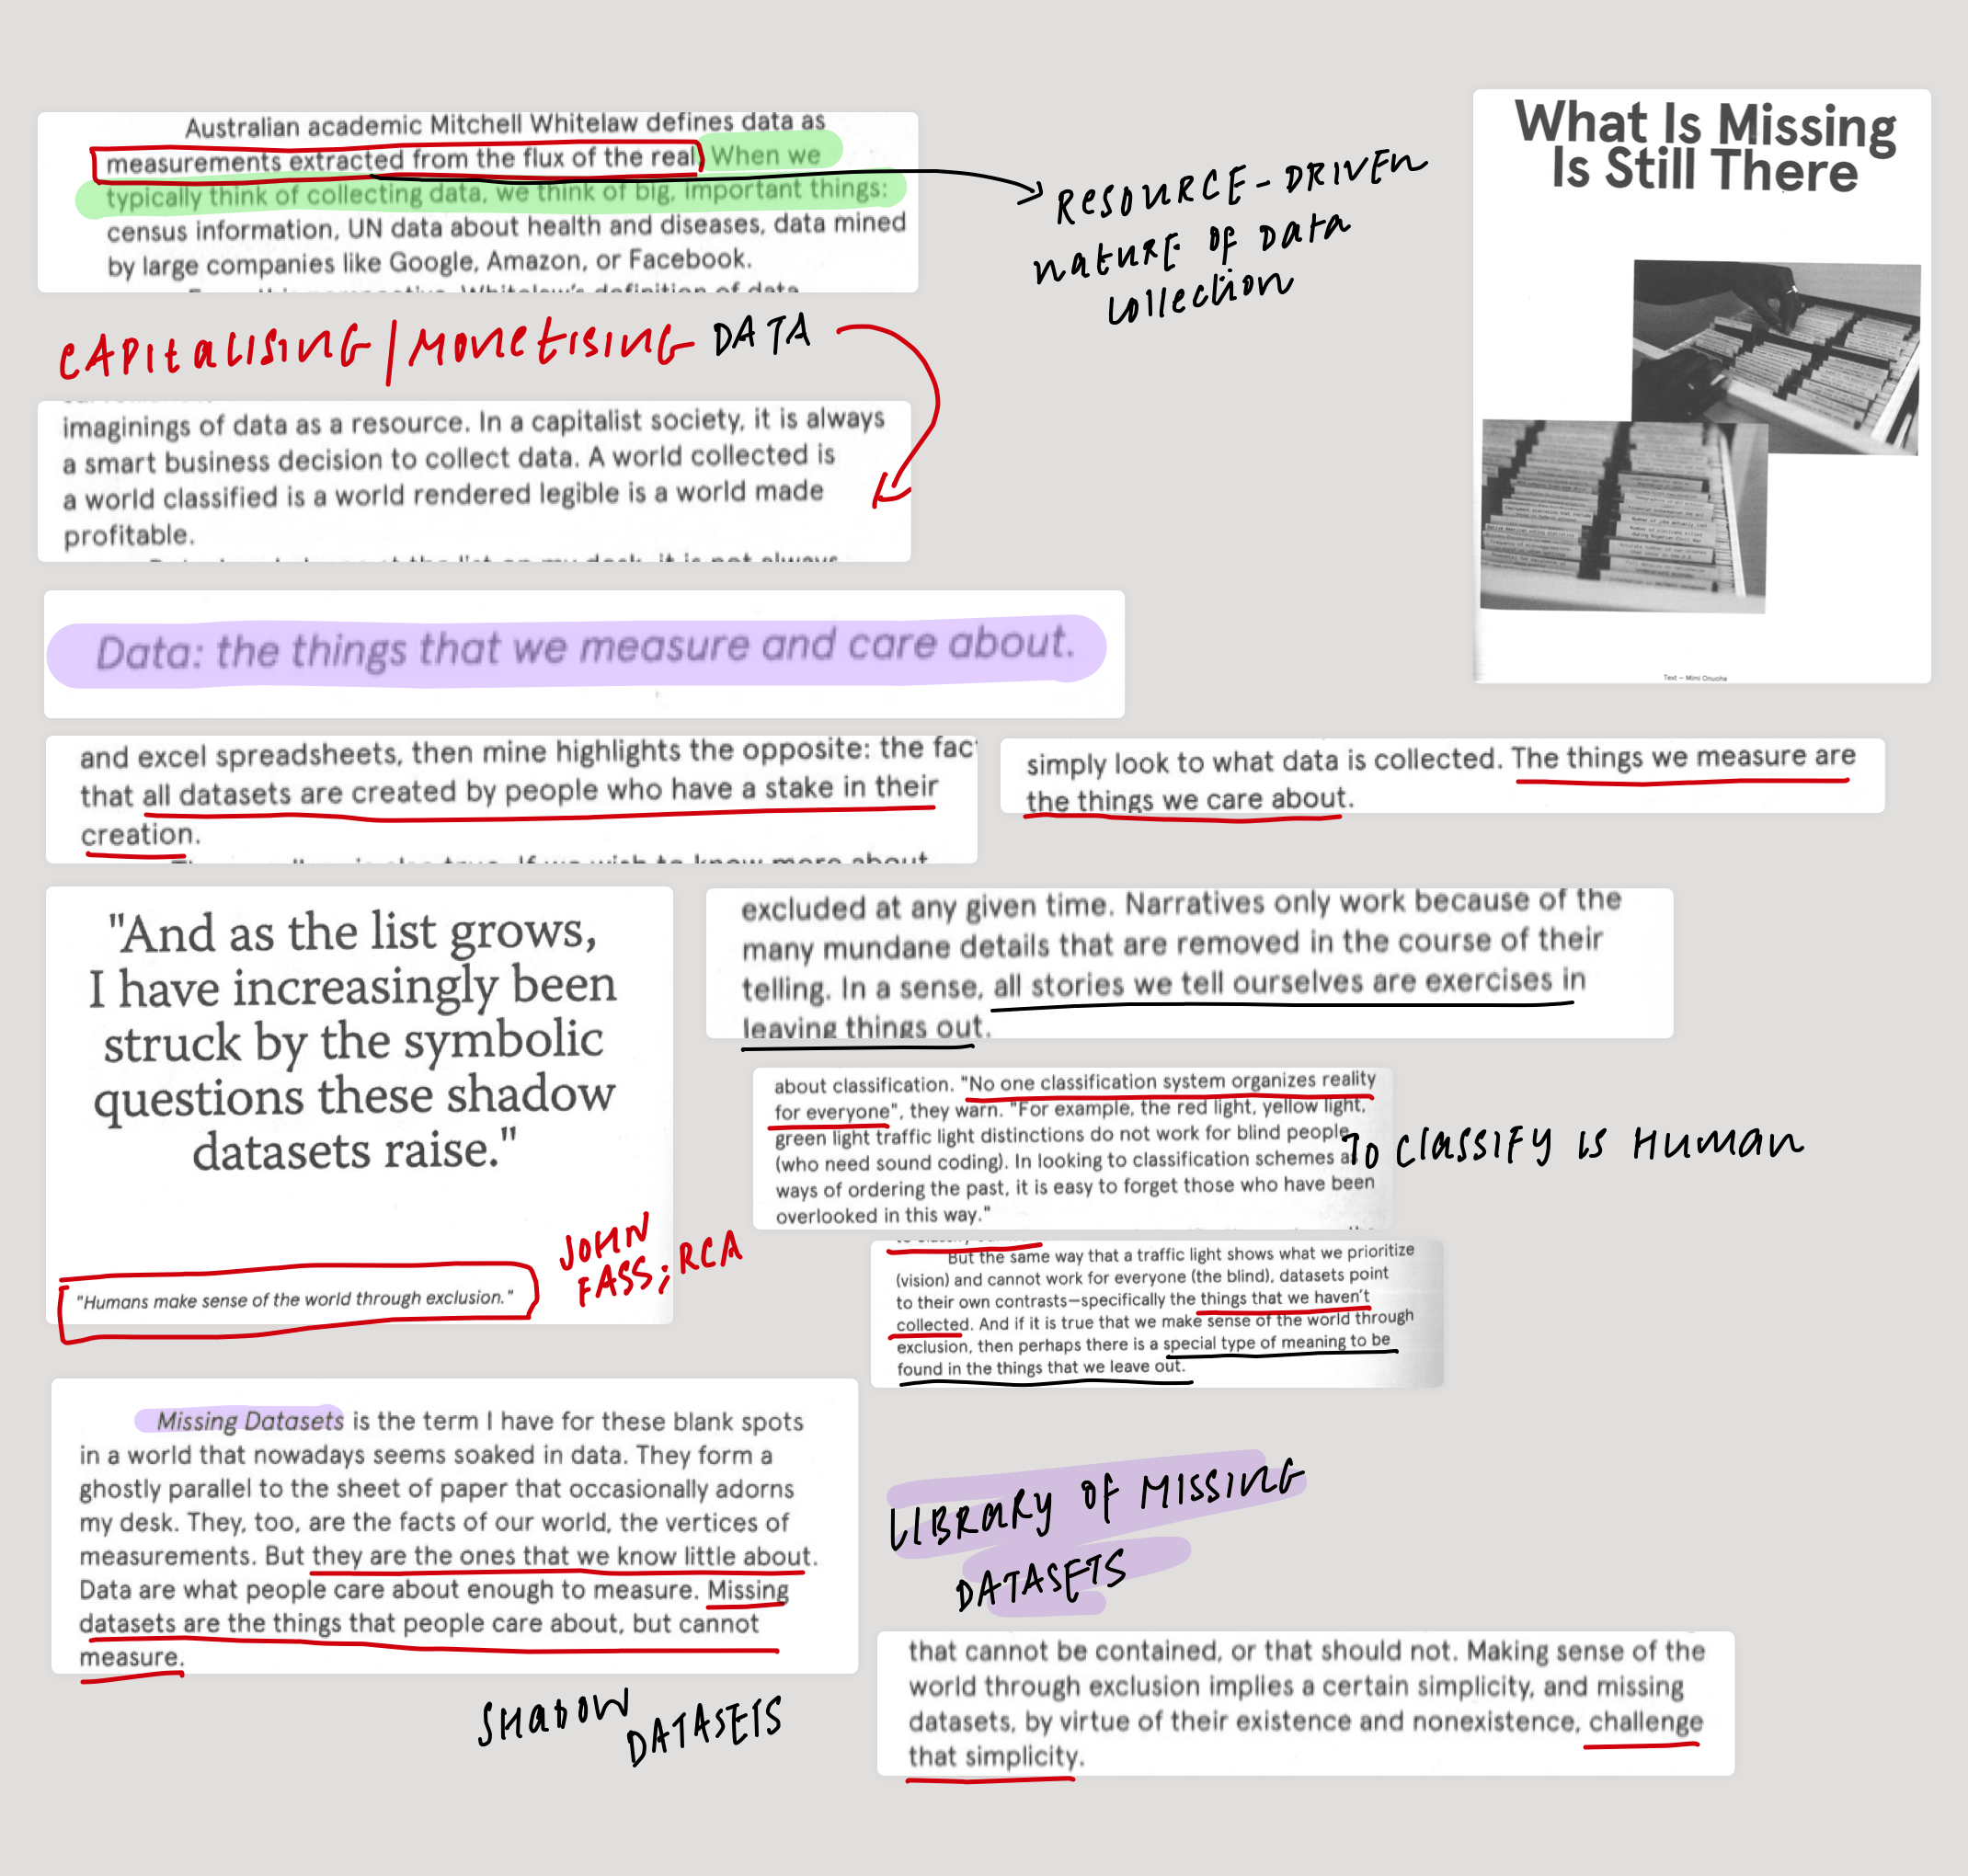
I have also been reading about data feminism and understanding what missing datasets are.