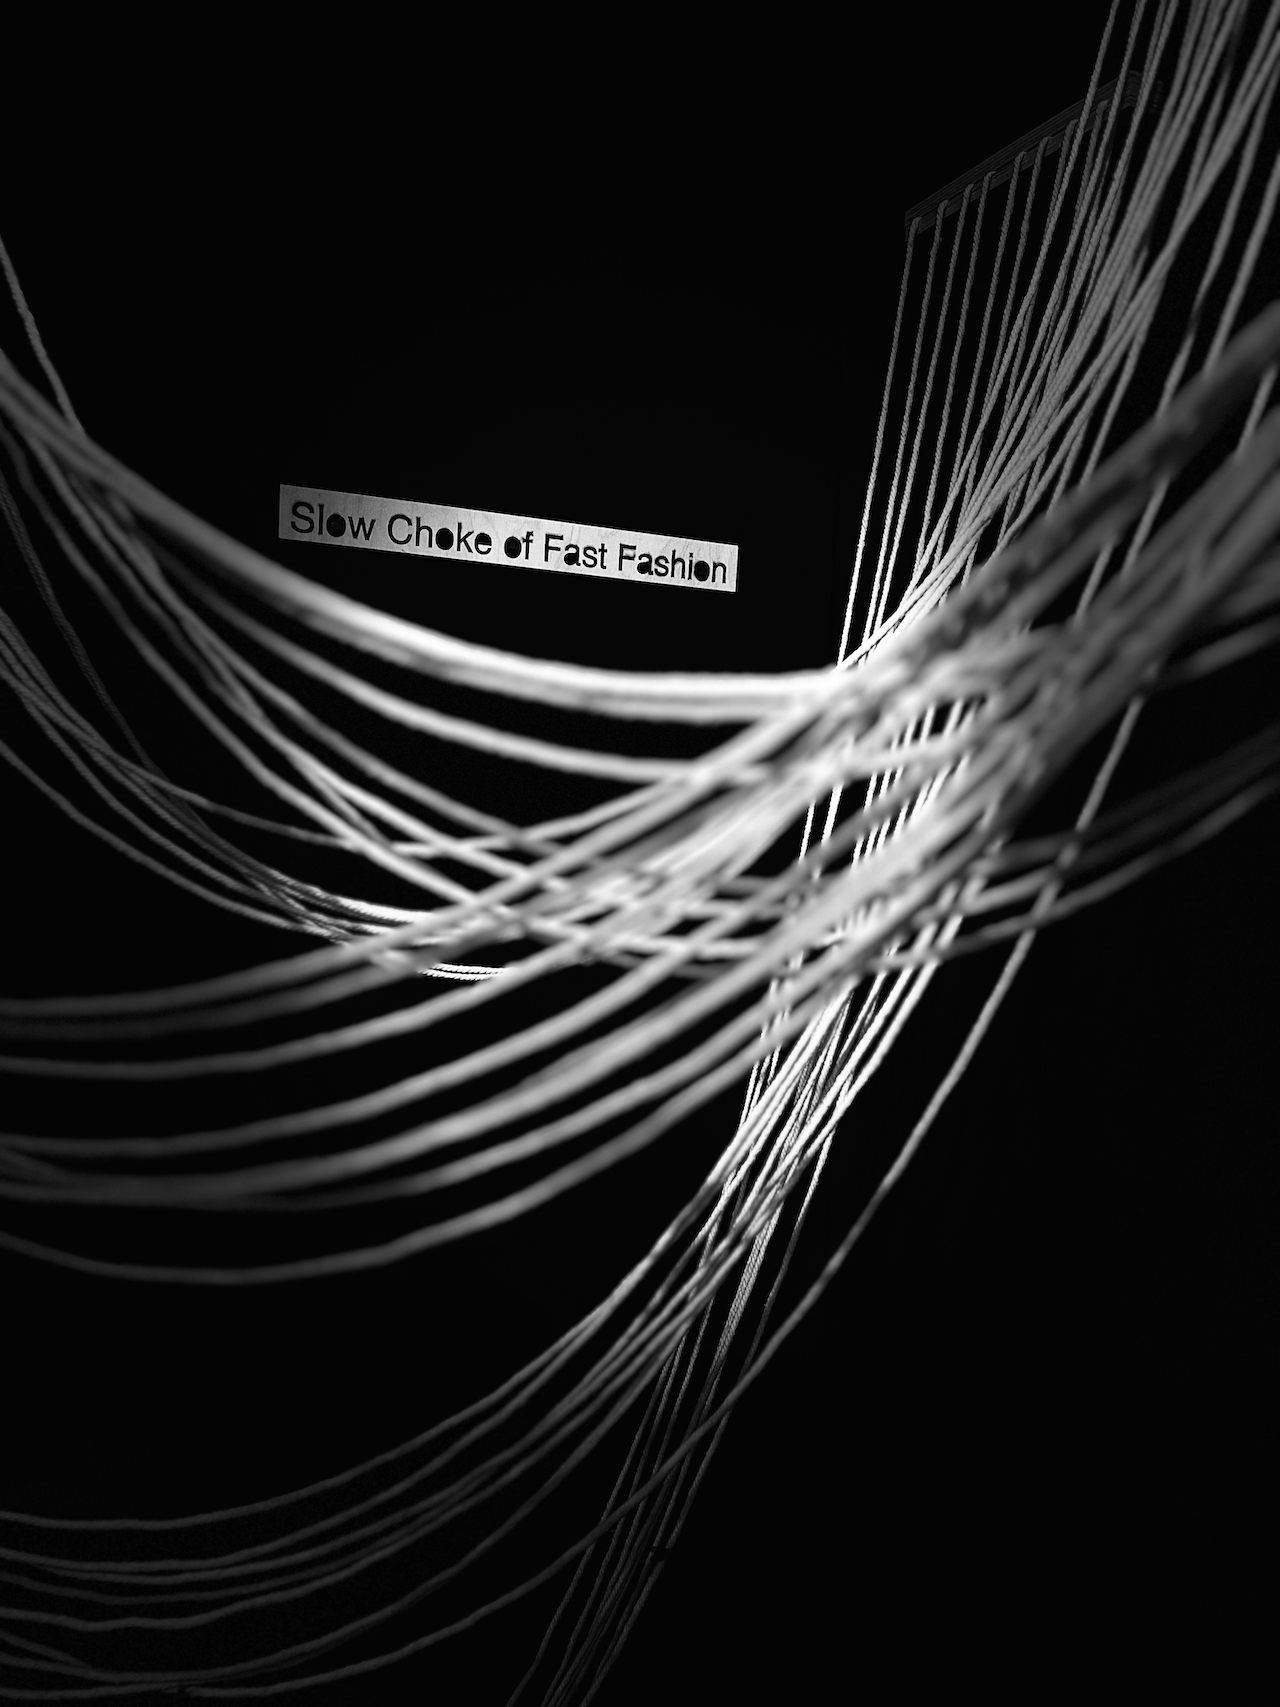
Slow Choke of Fast Fashion
- Data Physicalisation
This data experience compares our near ravenous appetite for cheap polyester clothes fuelled by fast fashion brands against the slowness of it’s discard and decay.
What are the costs associated with producing, consuming and disposing synthetic clothing?
The discord in this work captures the contrasts between fast and slow, the shortness of our desires and the longness of their consequences.
Context
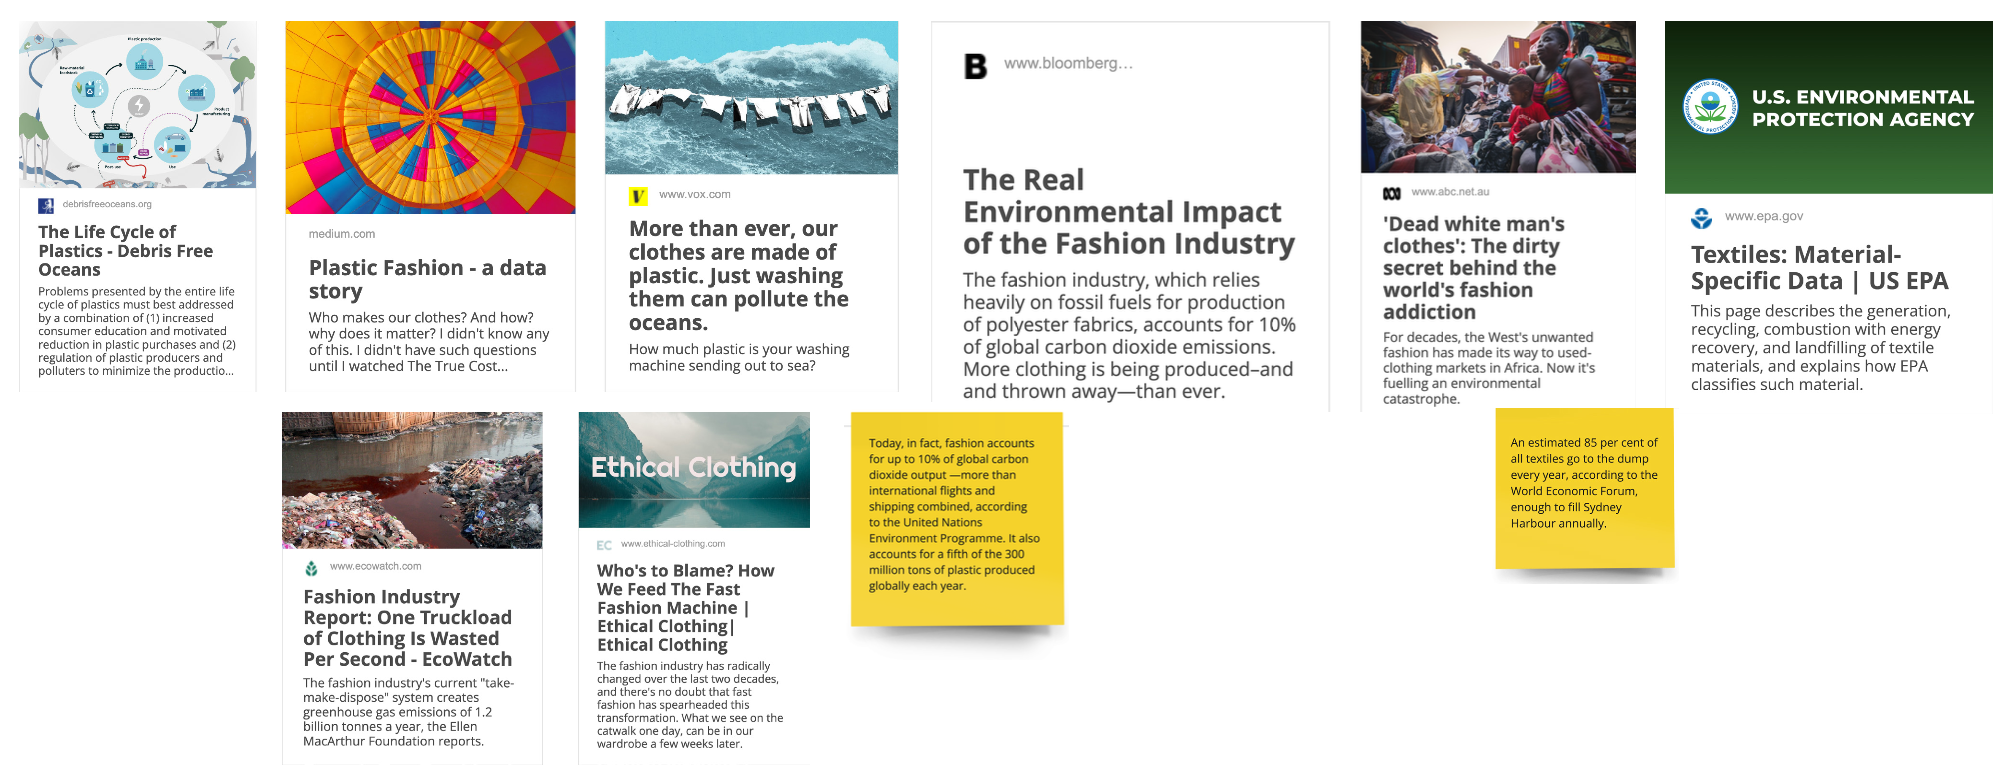
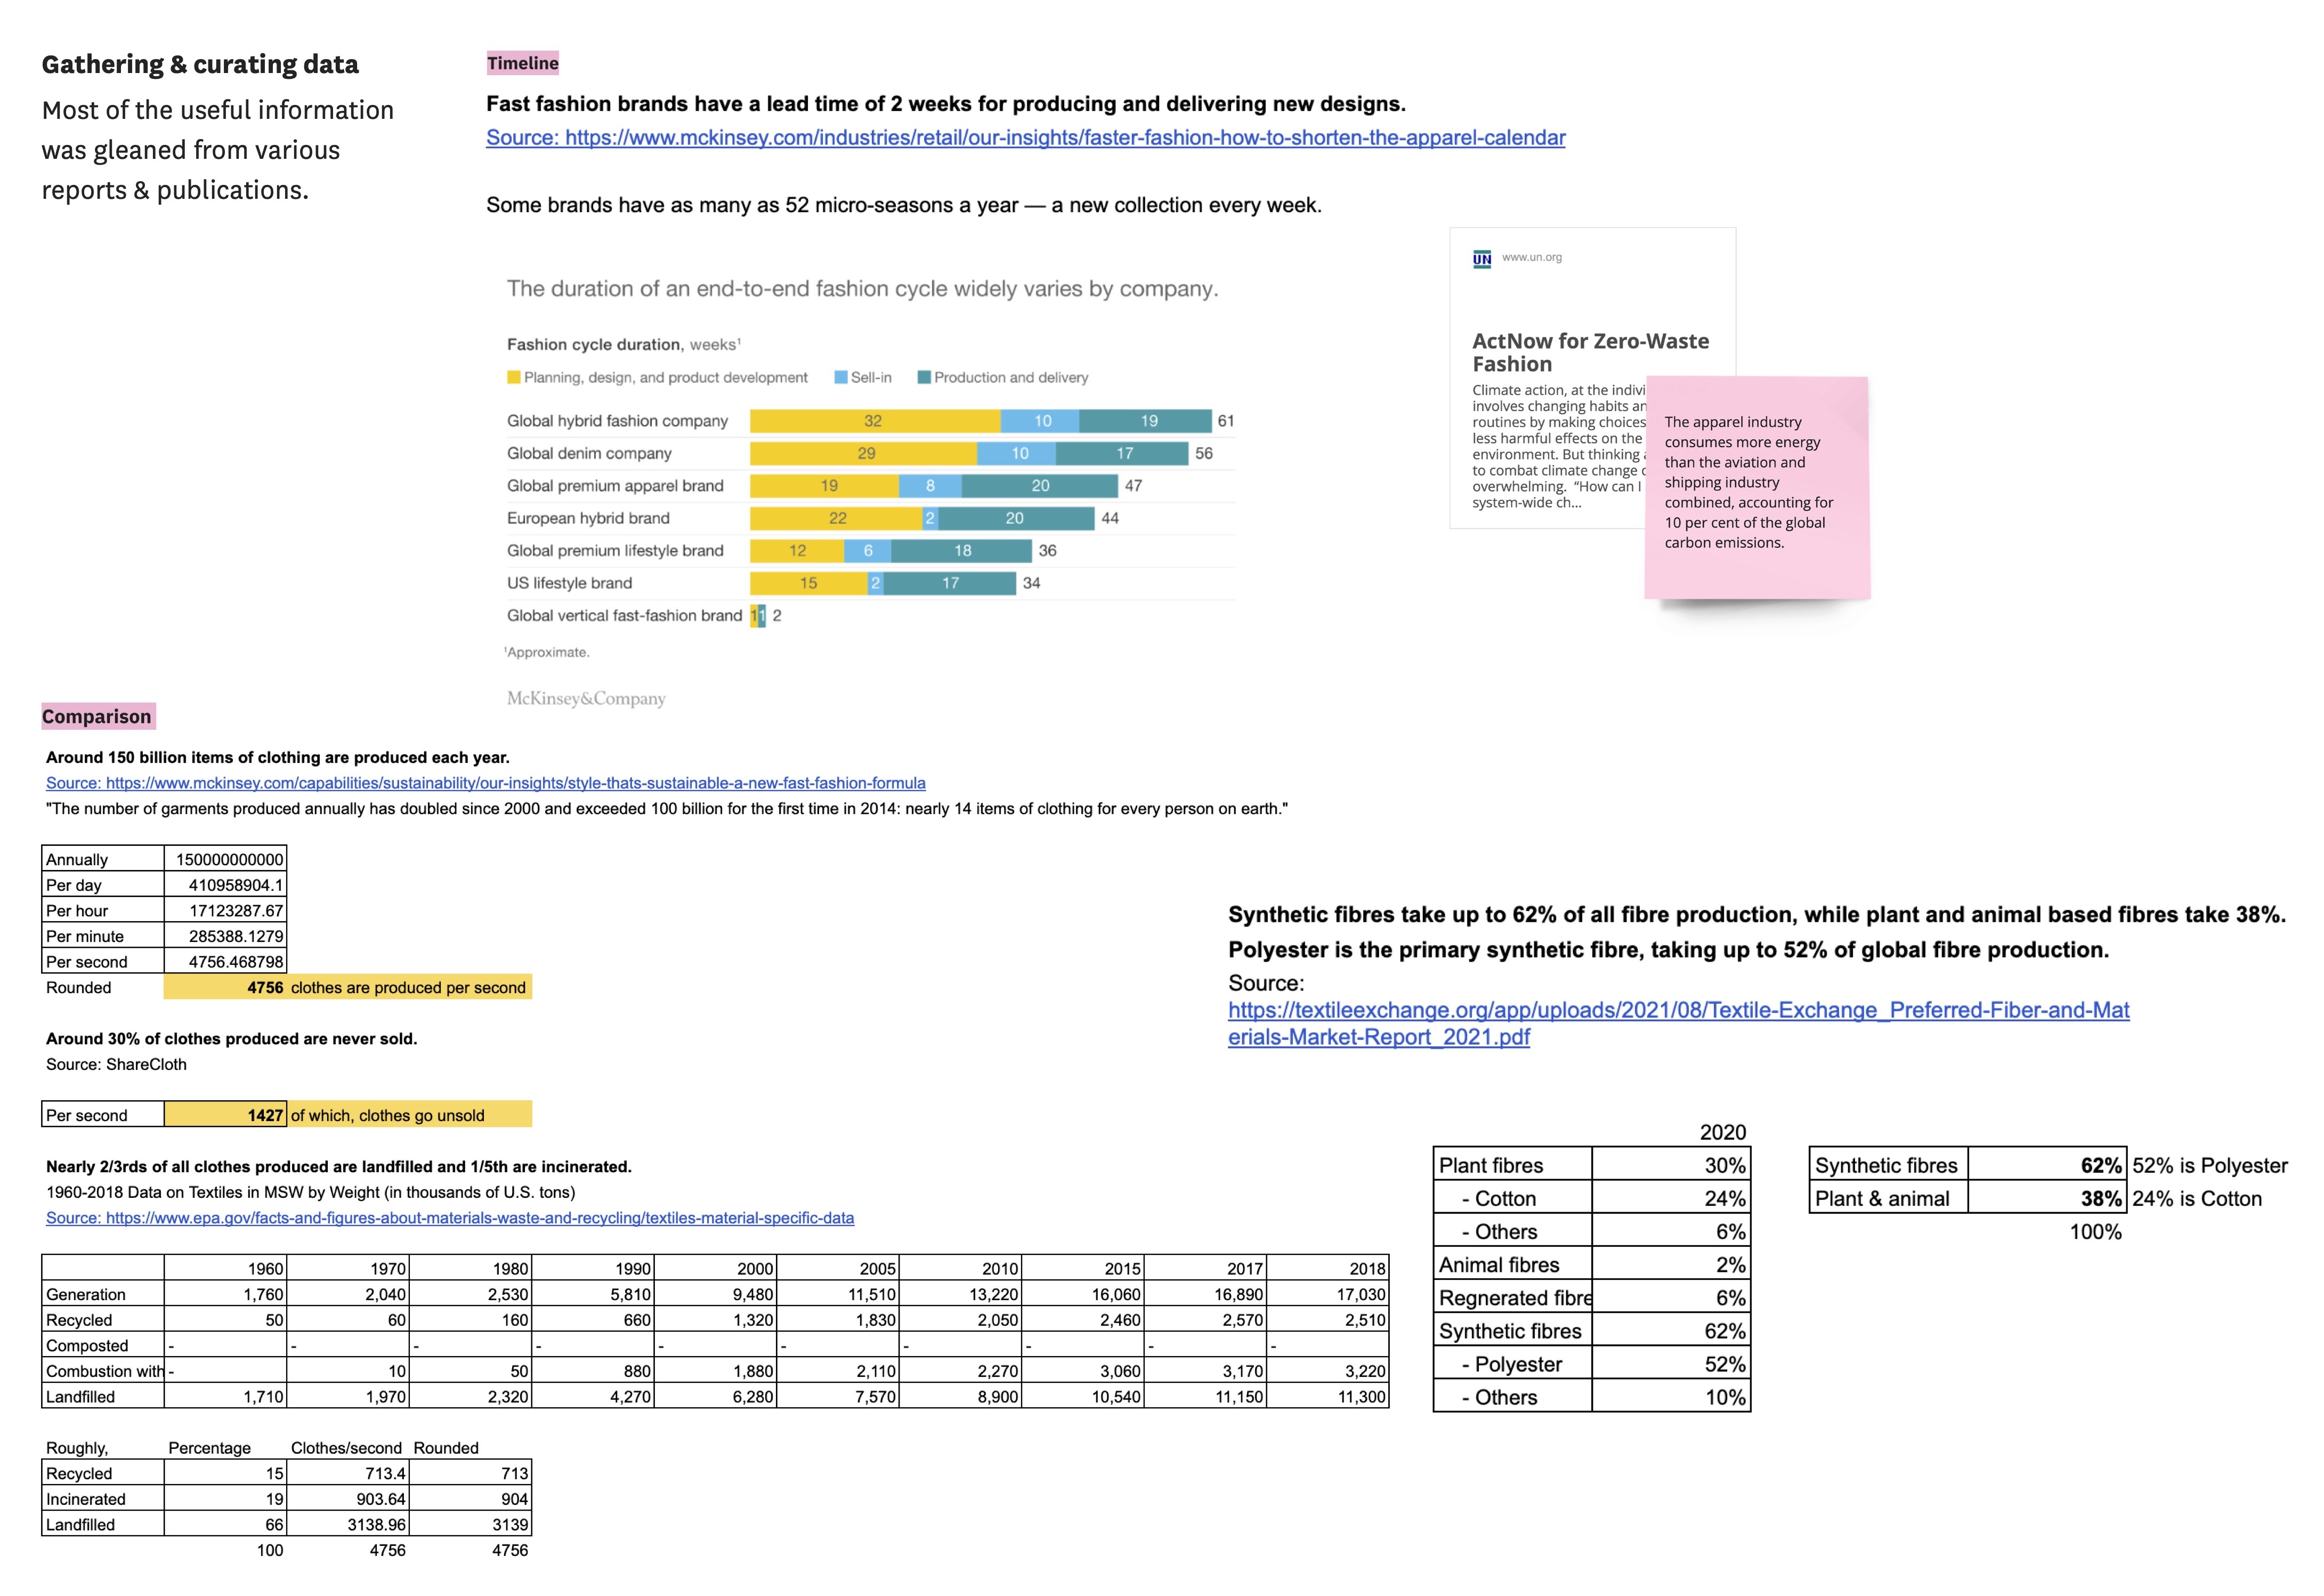
An estimated 35% of micro-plastics polluting the environment can be traced to textiles, particularly synthetic fibres such as polyester which have become the mainstay of fast fashion brands. Only a small percentage of clothing is recycled leading to the rest ending up in a landfill or incinerated. This issue is exasperated by 30-40% over-production by fast fashion brands.
Ideation & Concept Development
I broadly sketched out ideas for depicting individual elements of the narrative, considered visual language and possible semiotic references such as piling, choking, endless, and so on.
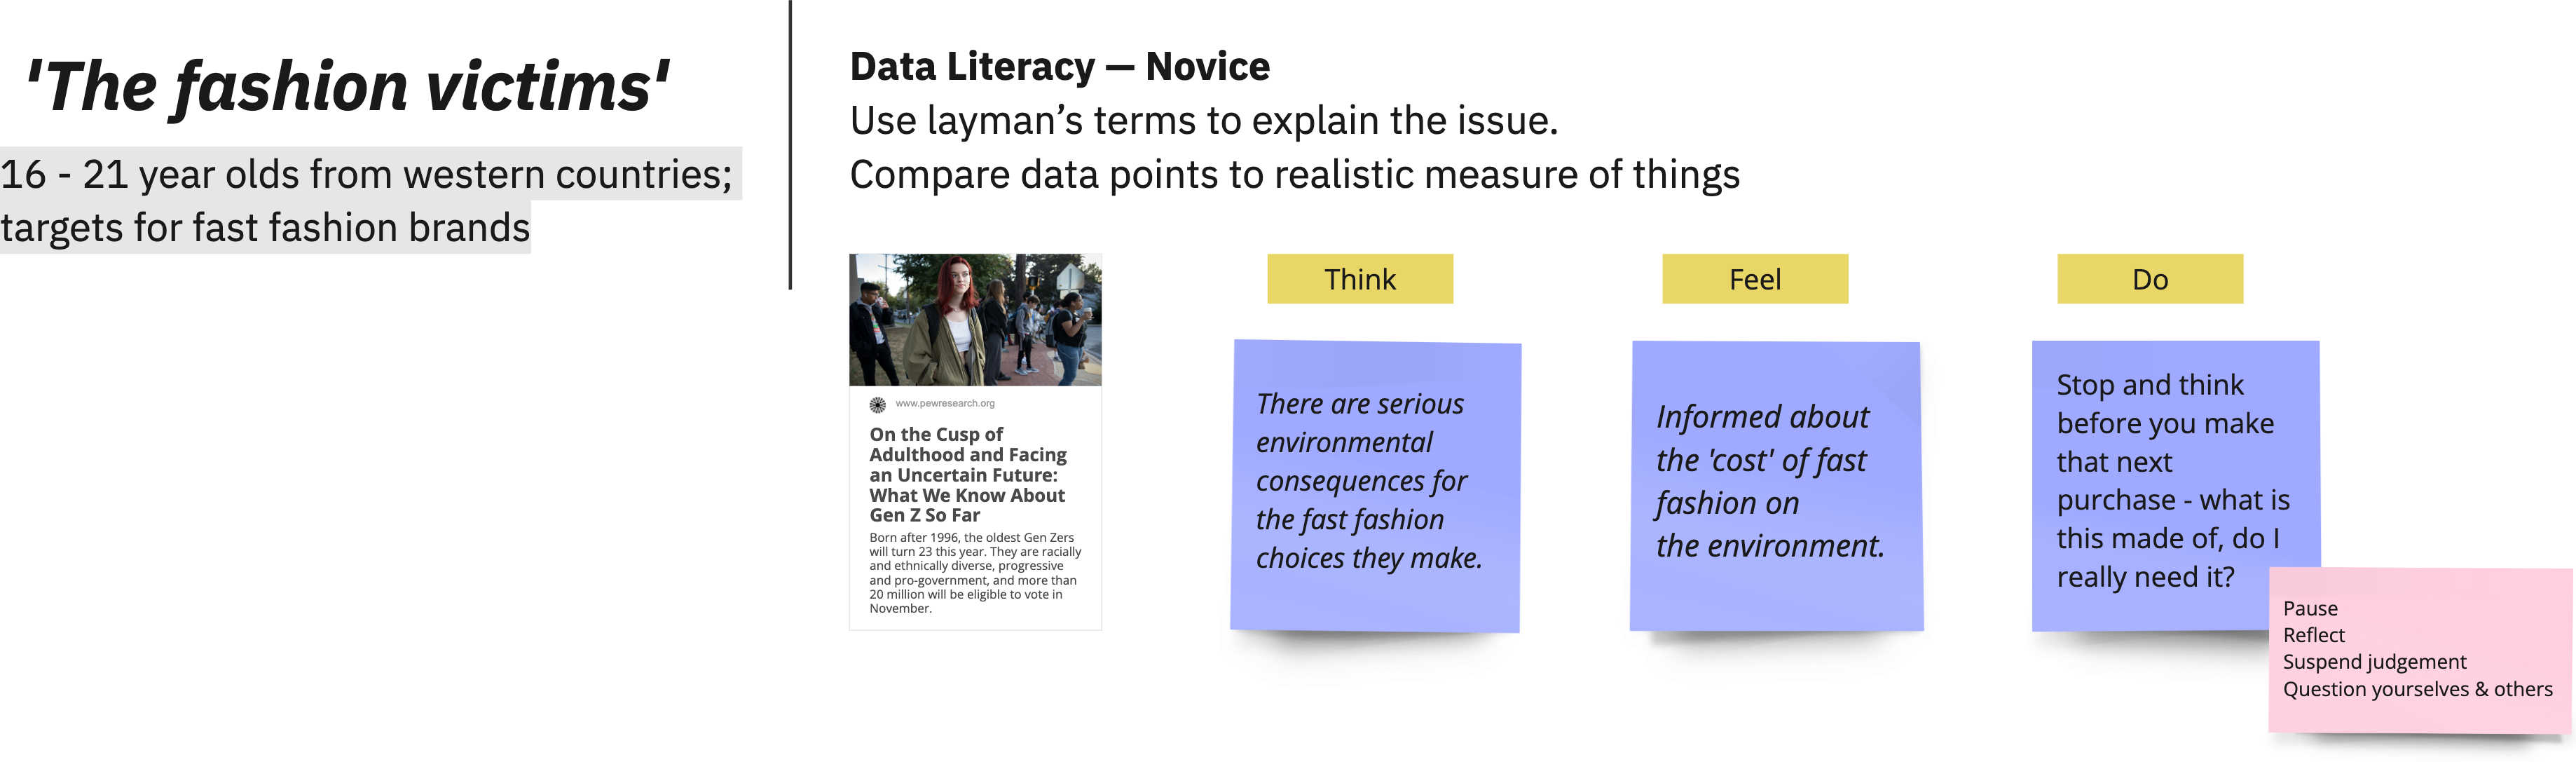
I investigated ways to transcend the psychological boundaries of scale, time, geography, and philosophy [1]. This exercise enabled me to take a step back and re-evaluate the key message I wanted to convey and its emotional impact on my audience.


To help my audience relate to the context, I considered using symbolic, indexical references such as cloth and plastic itself. I sketched different ways to juxtapose the data in order to better depict the comparison in quantities of clothes produced and discarded.
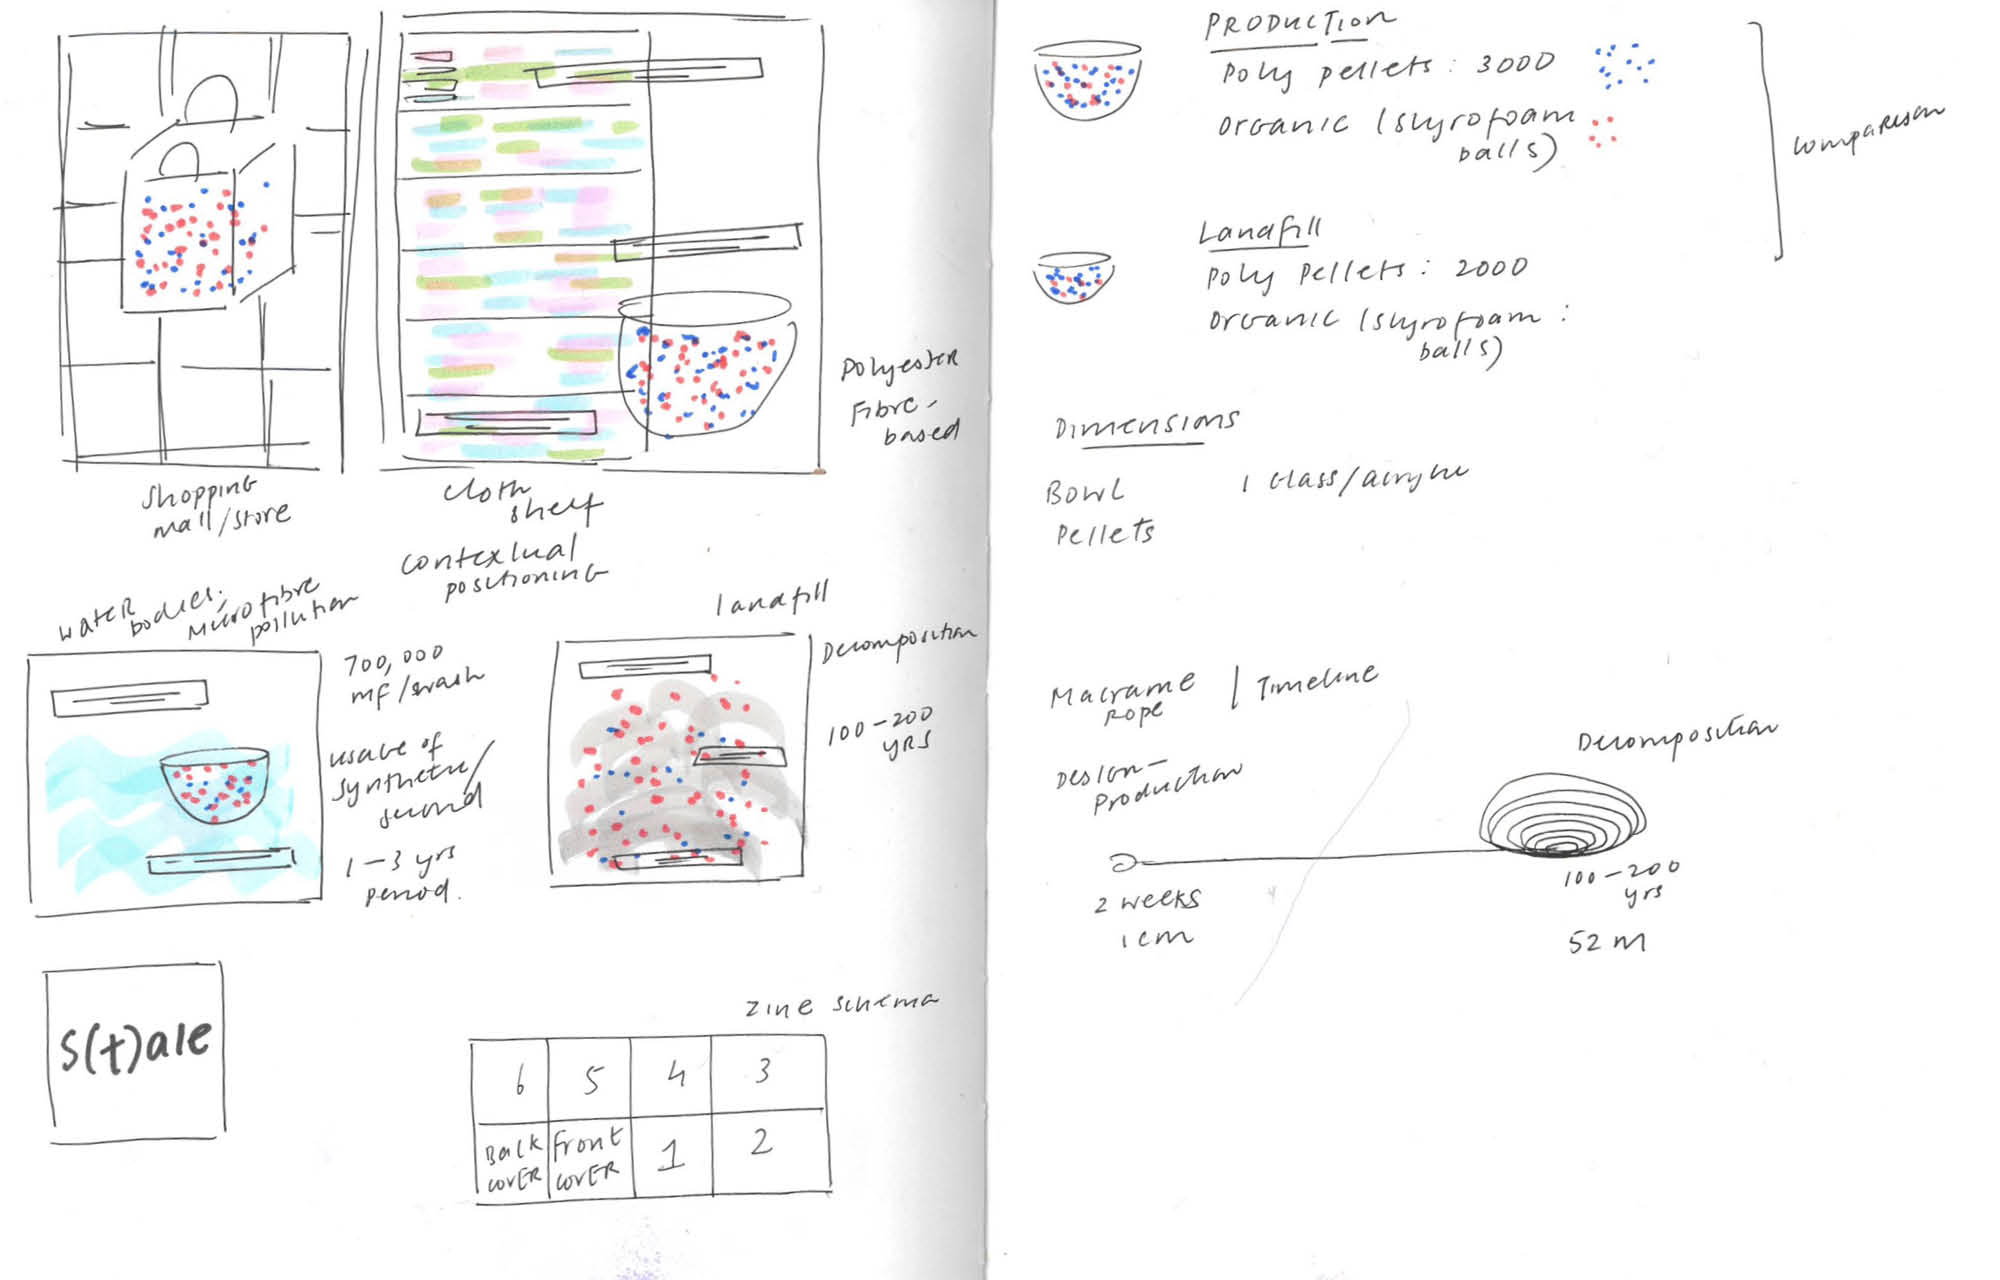
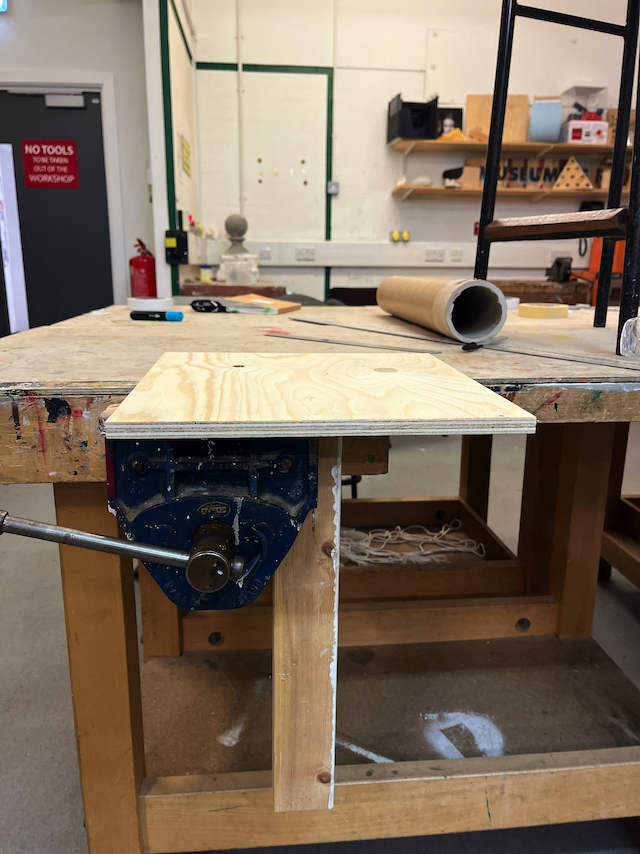
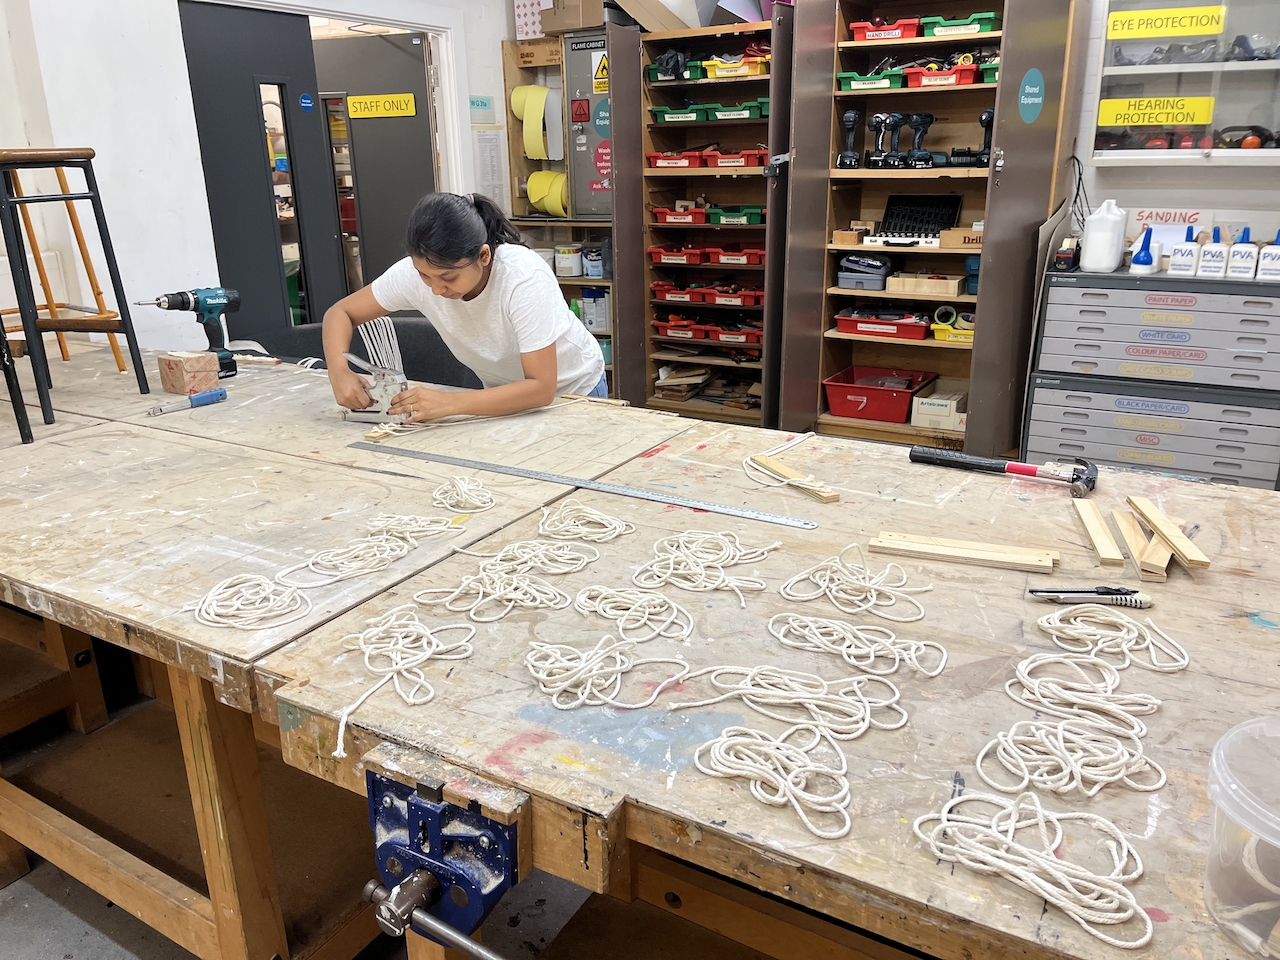


Installation
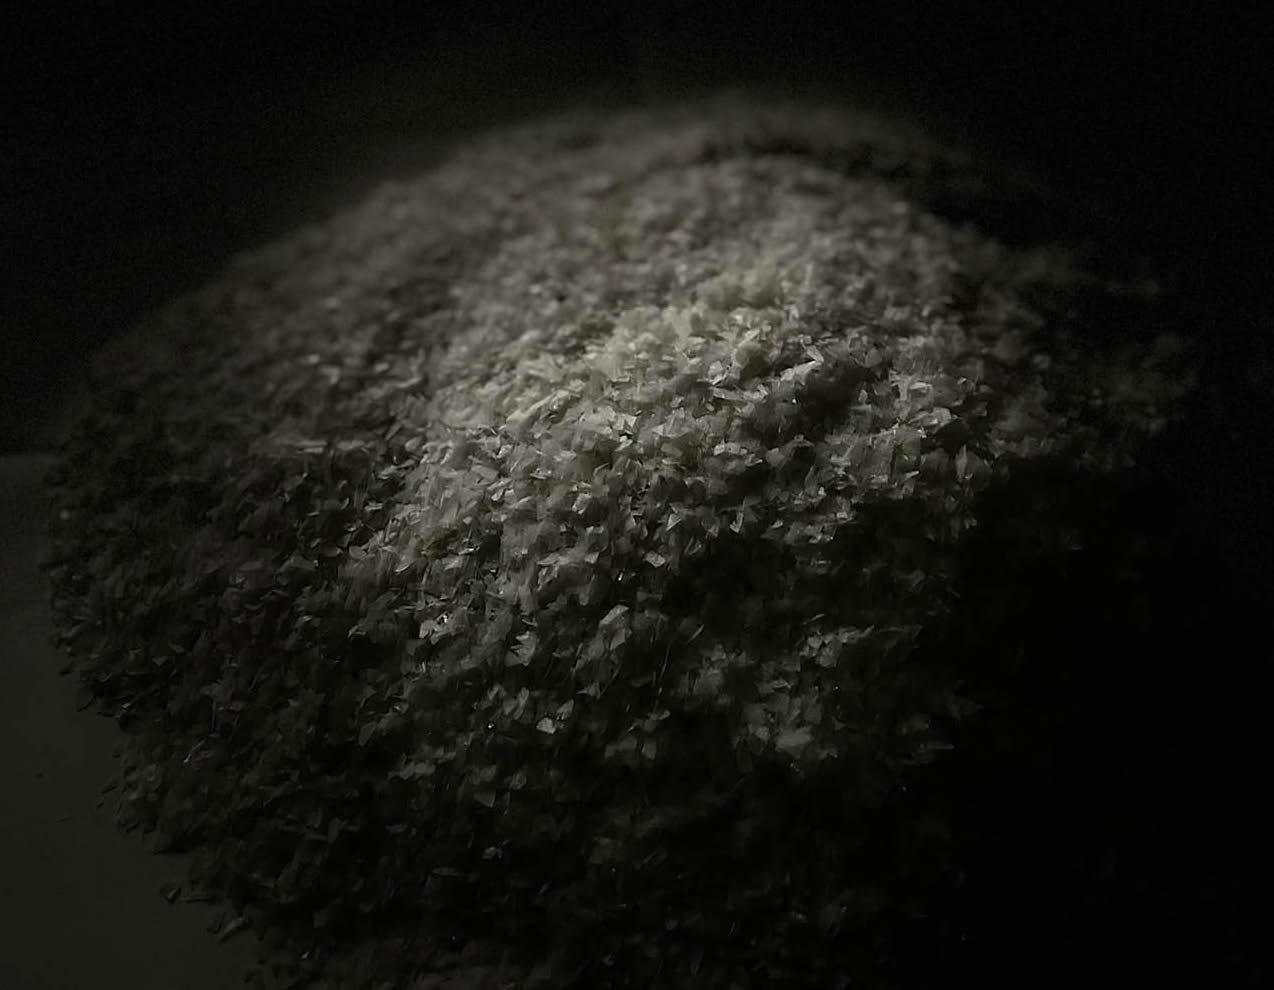
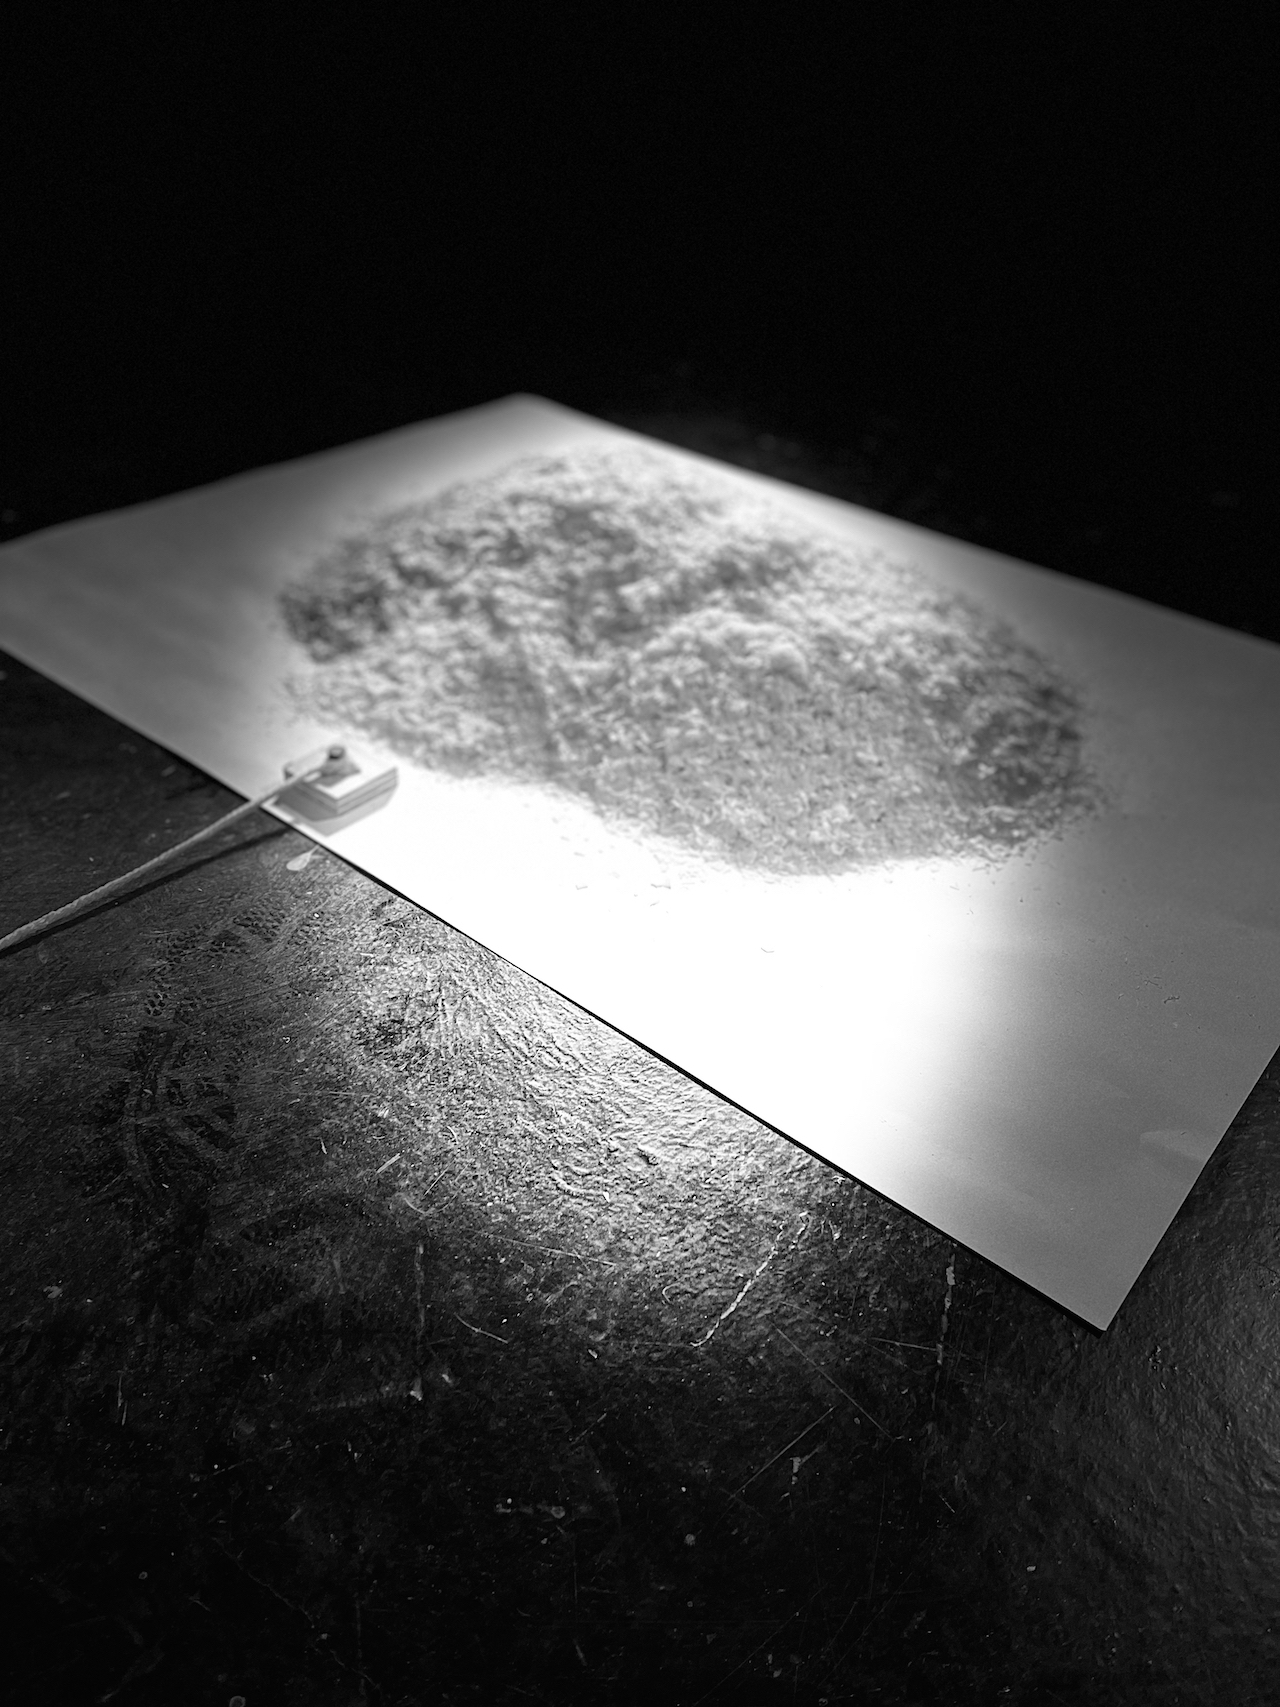
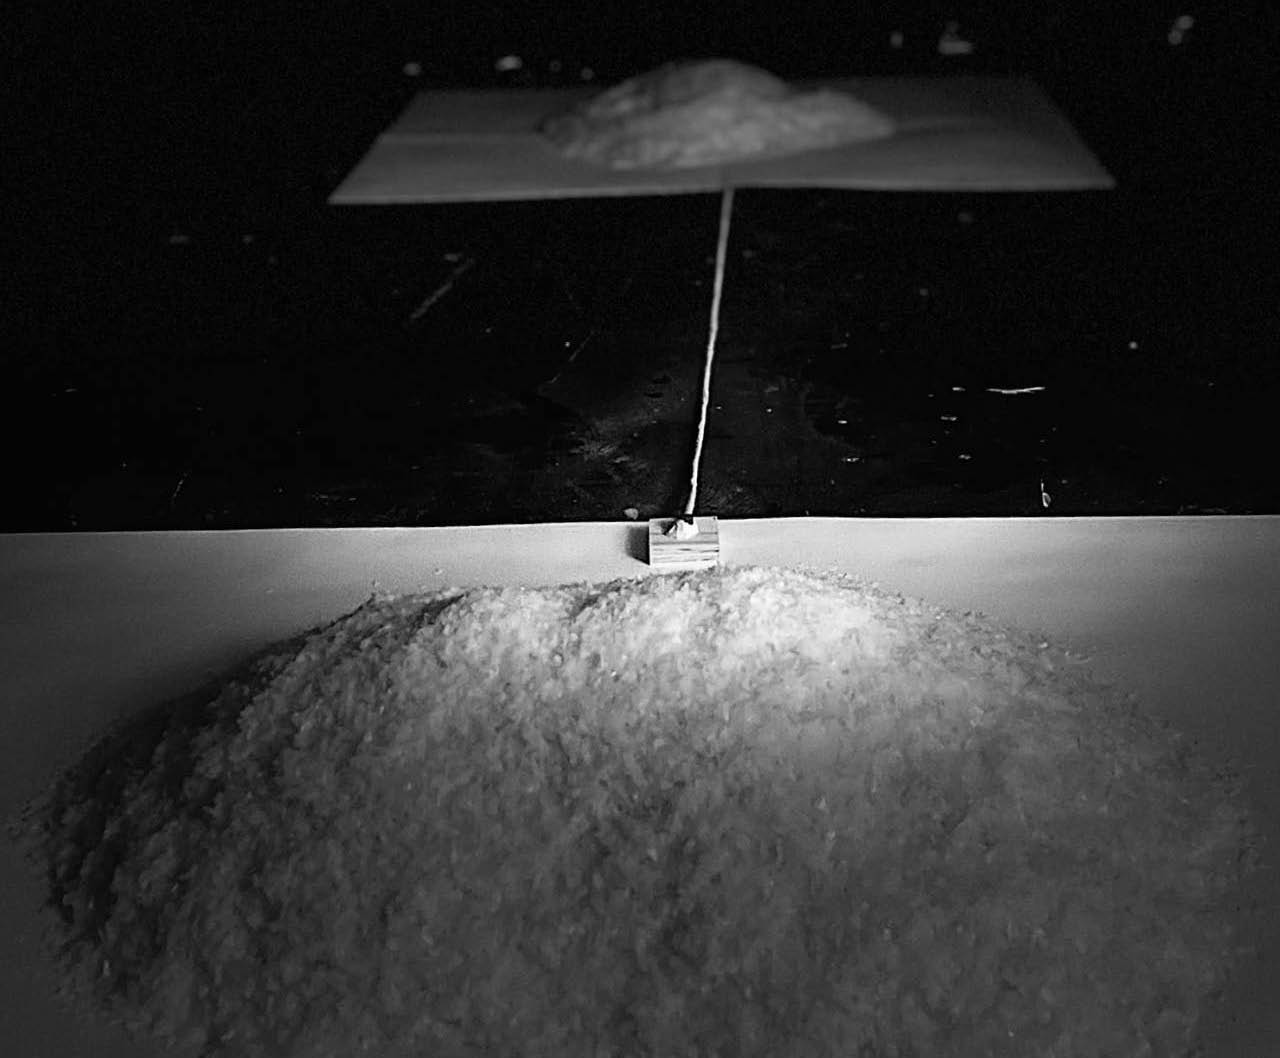
The pile — a comparison
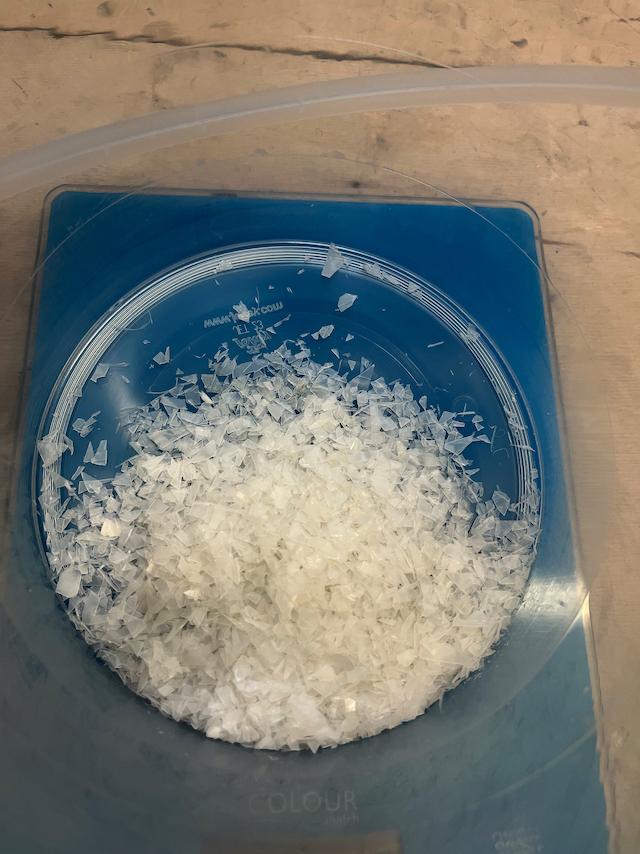
Two piles of ground plastic flakes are placed on the floor, one larger than the other to represent the quantity of clothes produced vs. discarded on landfills every second. One piece of polyester clothing is represented by one gram of these flakes. Plastic was used as an indexical reference to represent polyester. These flakes are ground from used milk cans (HDPE) and are recyclable.
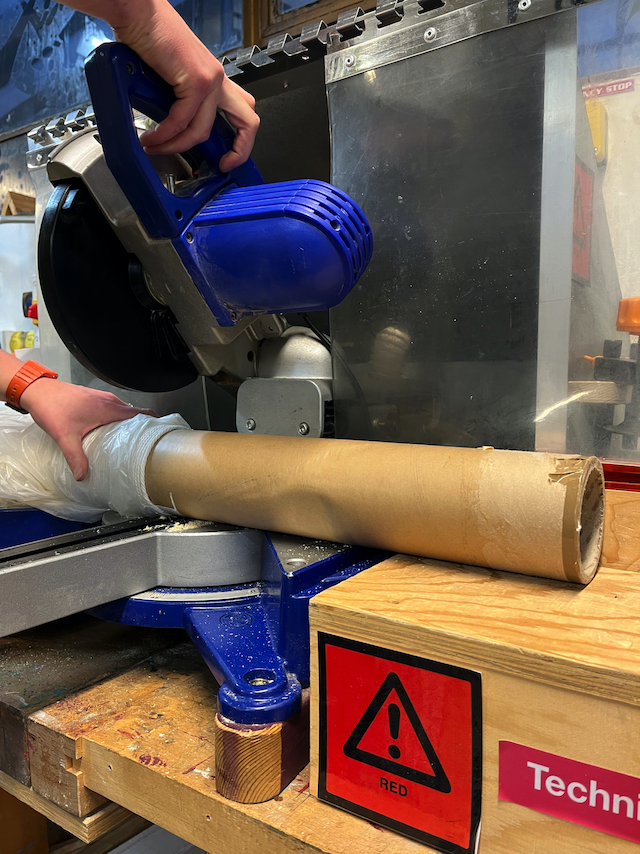
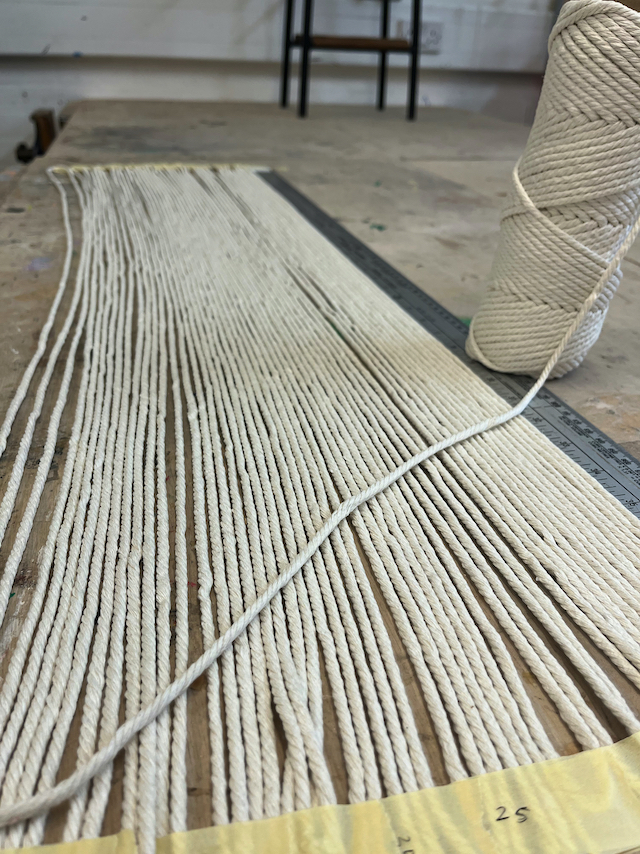
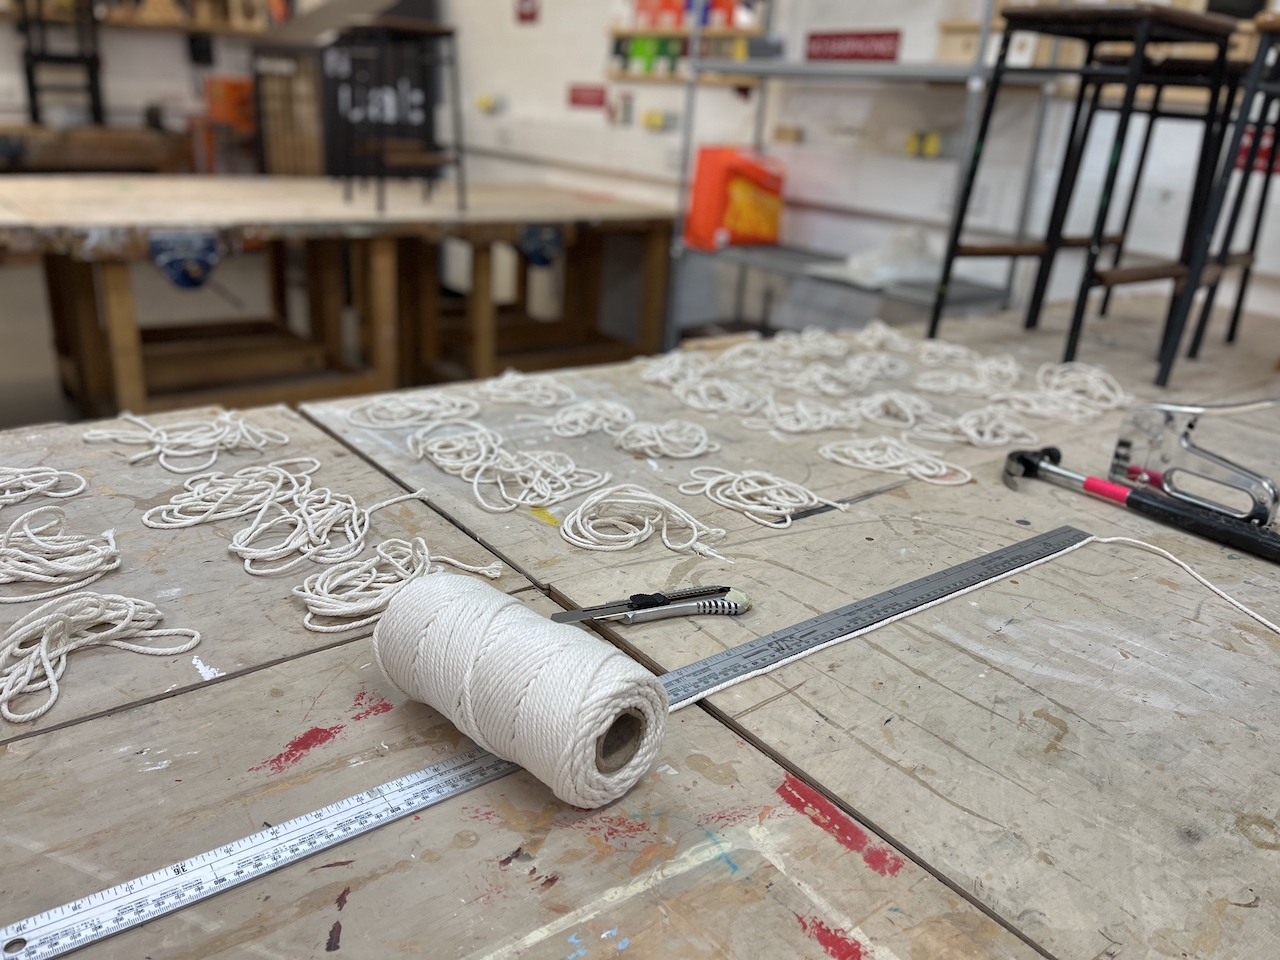
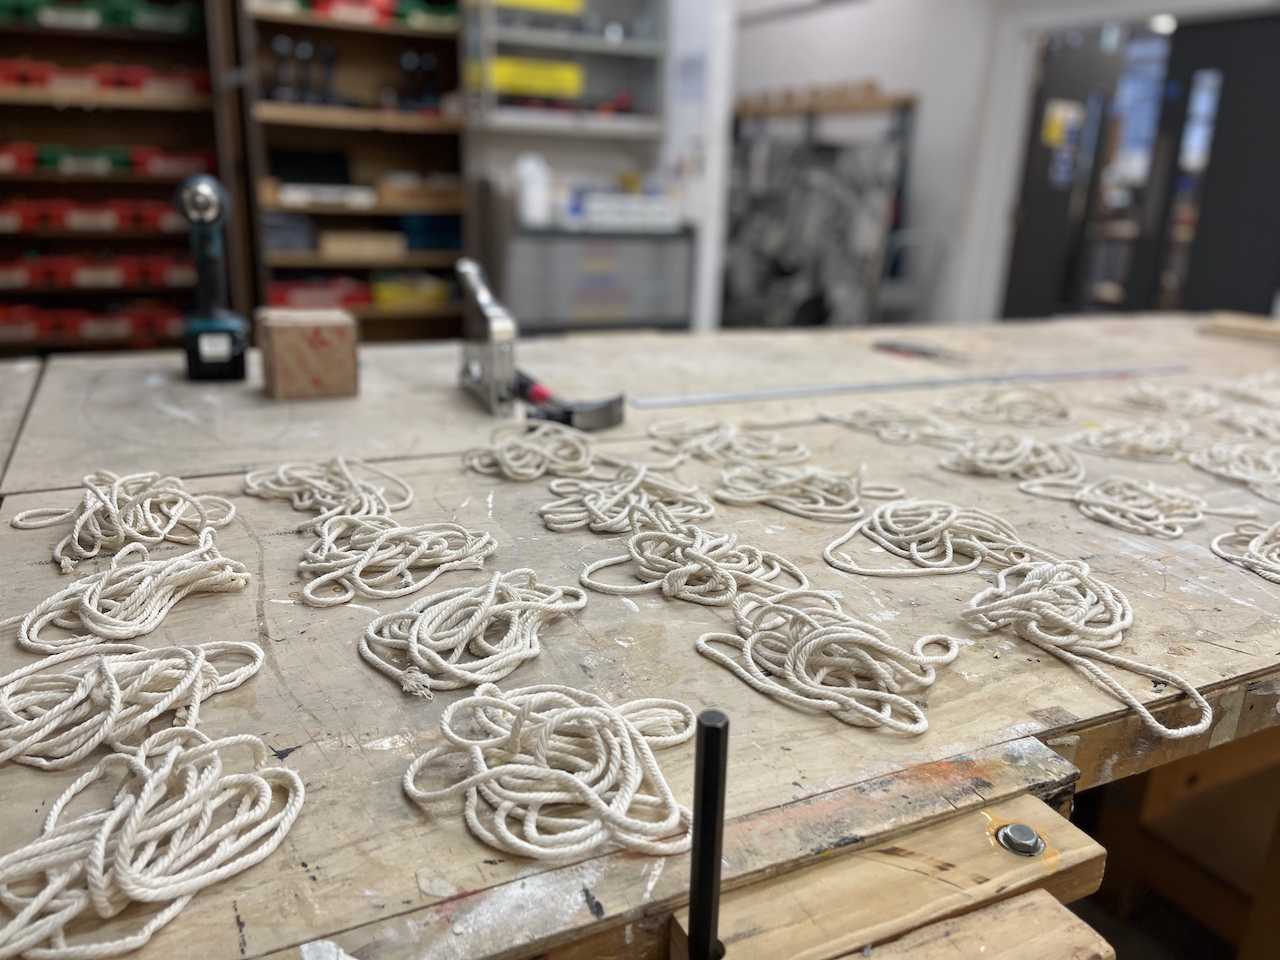
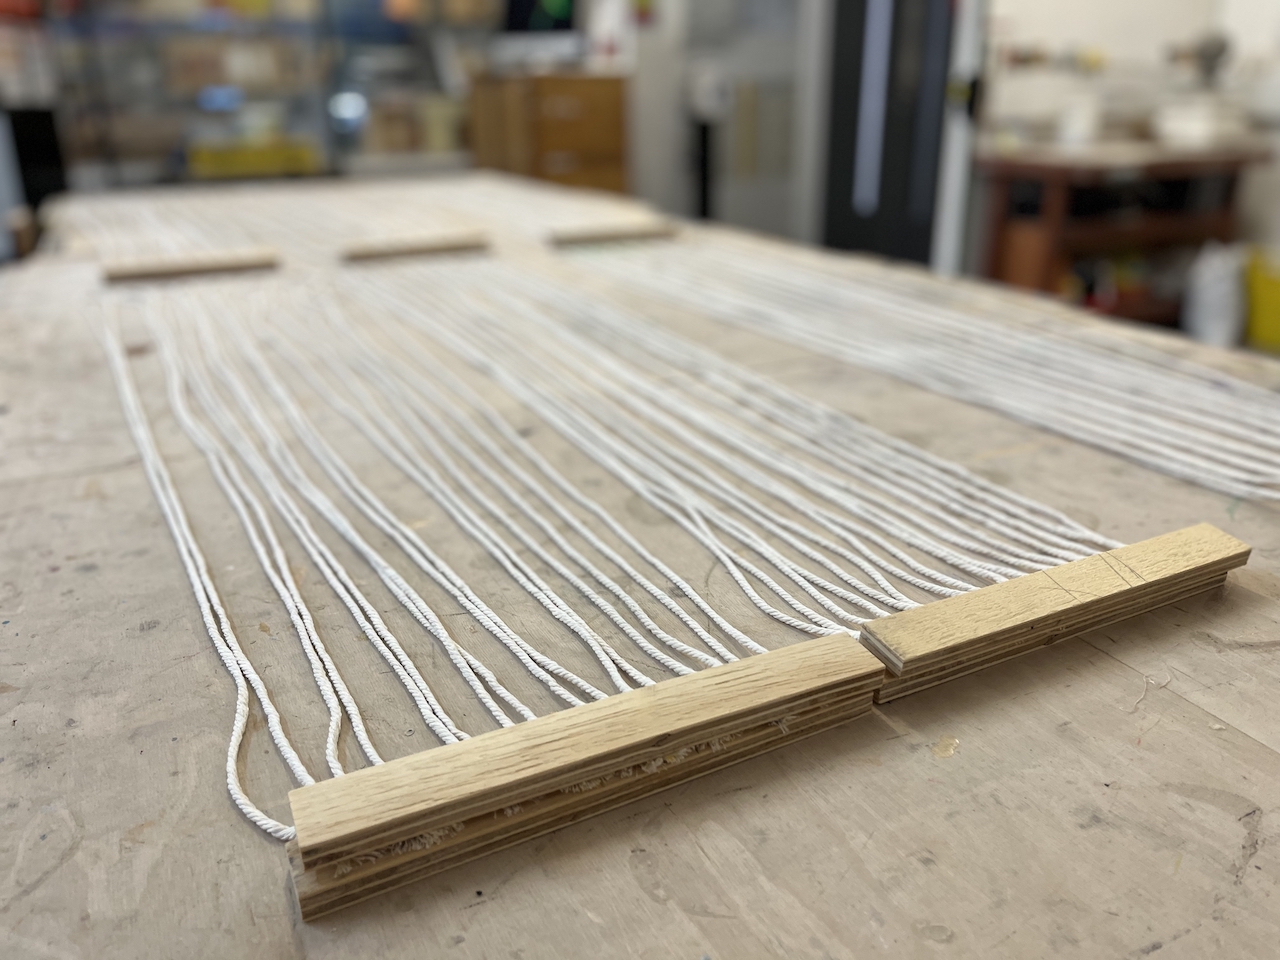
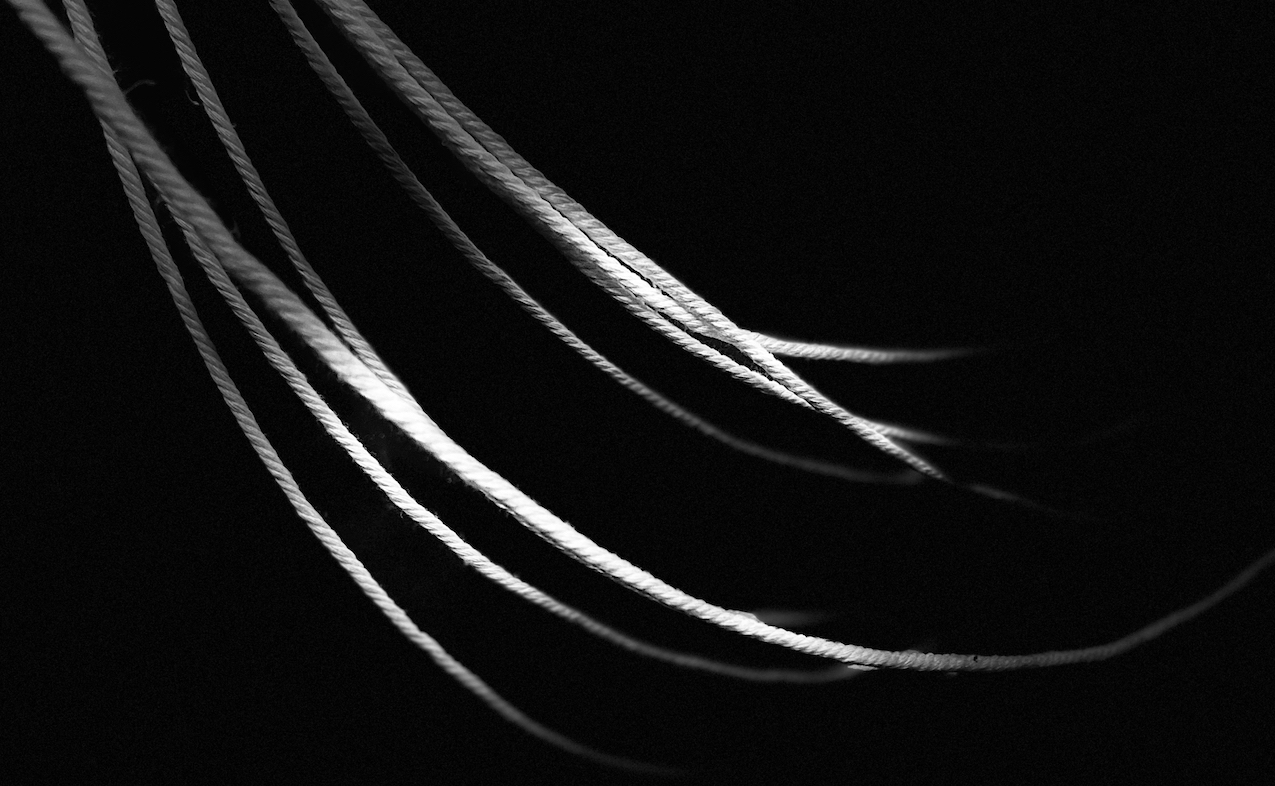
The thread — a timeline
I used twine as a material to depict the timeline of a piece of cloth as it goes from production, usage, to discard.
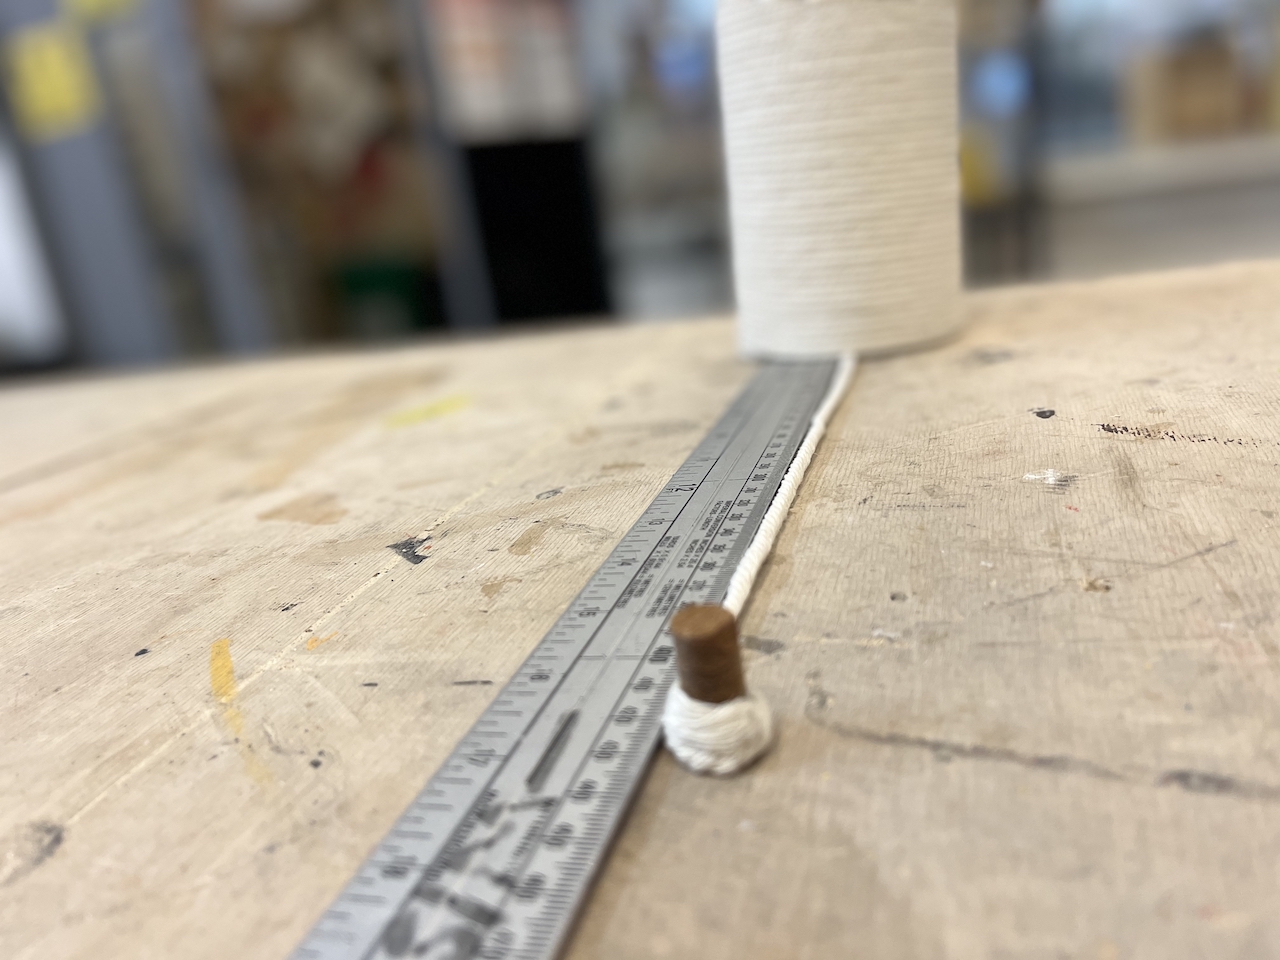
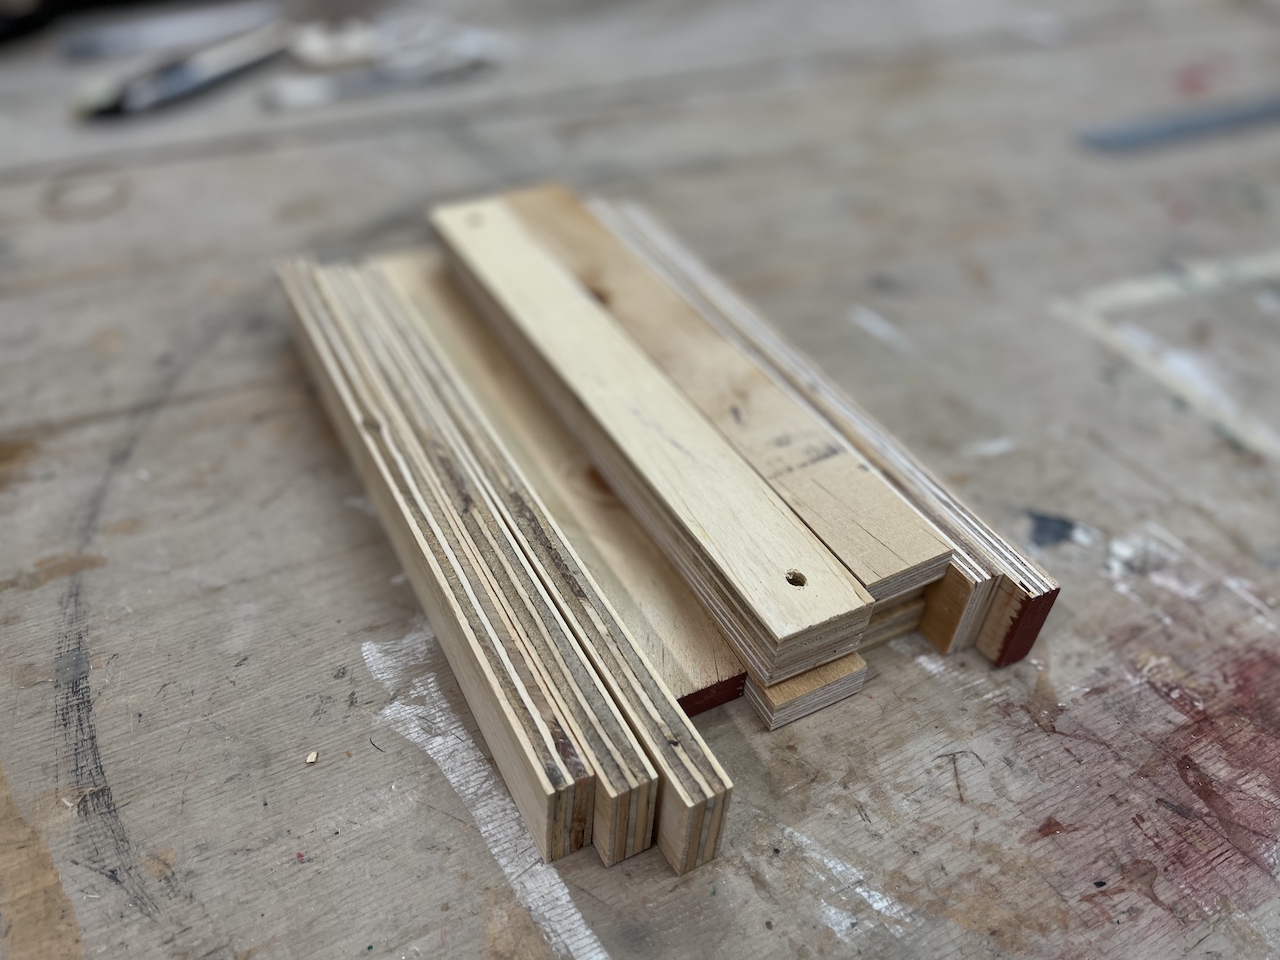
1 cm of twine represents one week. At the edge of the production pile, the thread is twisted around a small piece of wood to represent the two weeks taken by fast fashion brands to go from design to manufacturing a new line of apparel.
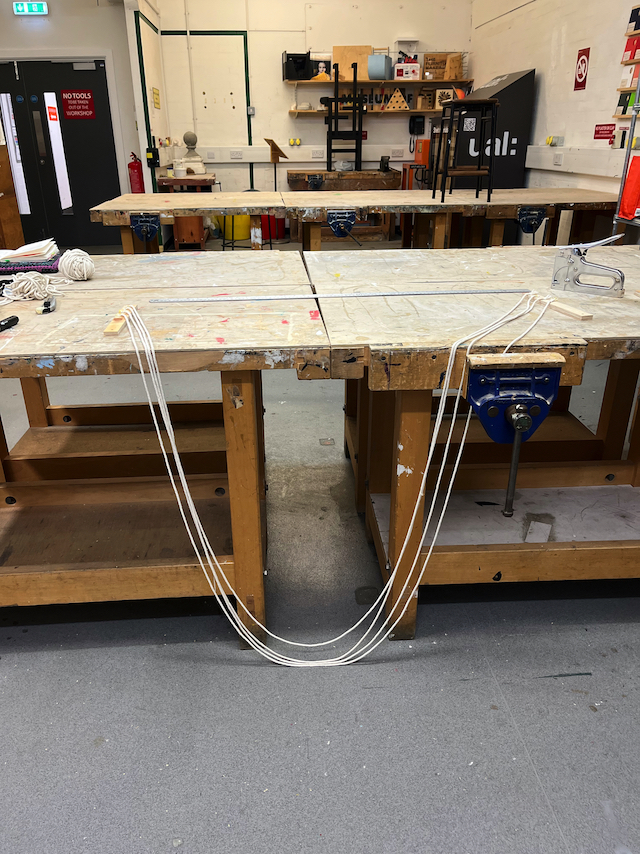
A 52 cms long thread connecting the two piles represents the average time of 1 year taken to discard a piece of clothing.
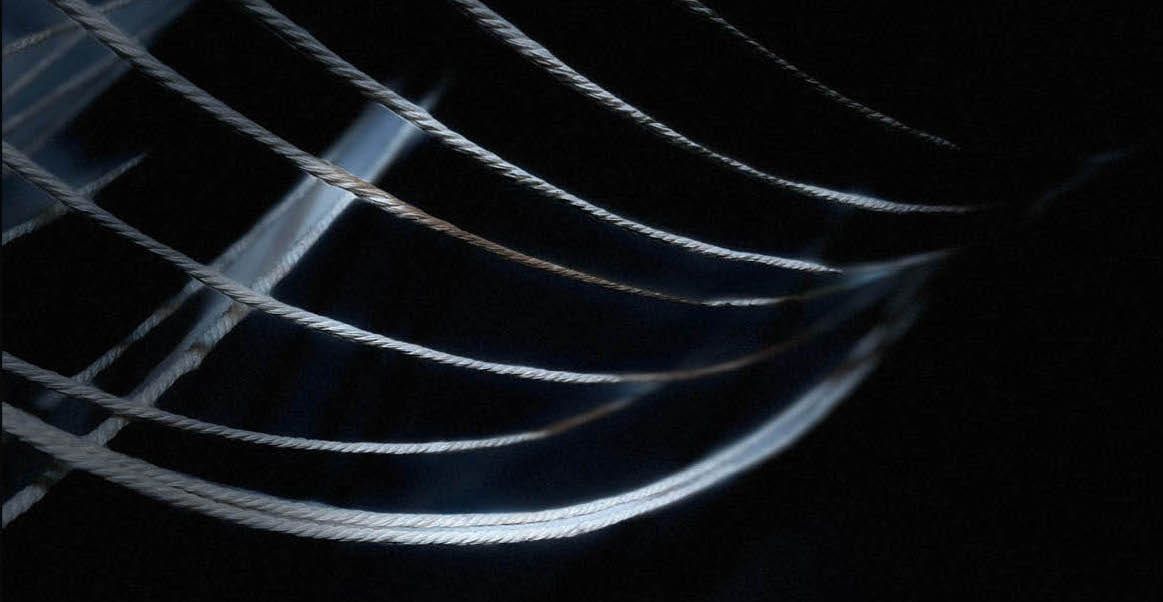
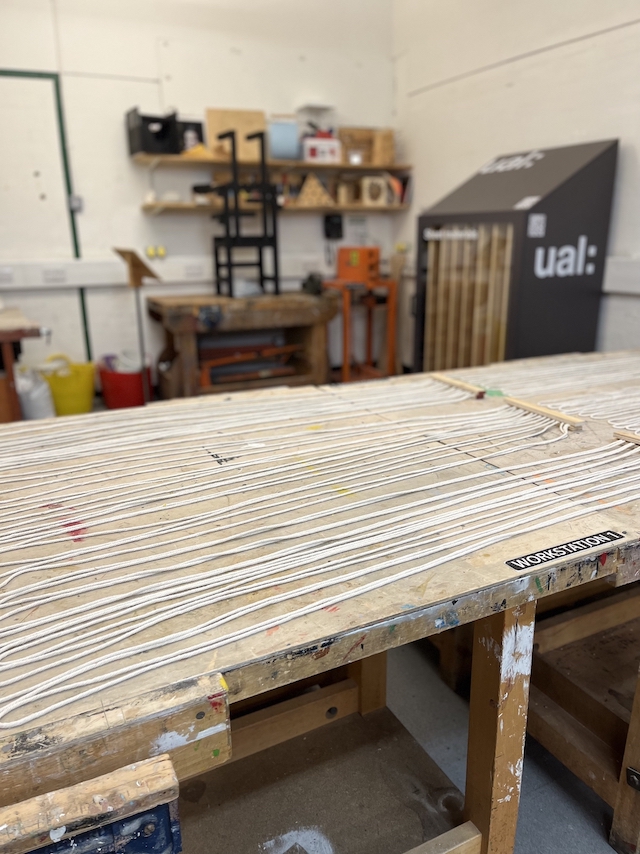
Finally, once the cloth has reached the landfill, it stays there, slowly decomposing for a seemingly endless 200 years. To depict this massive difference in time, I used 104 metres (2 x 52 weeks) of twine that is interleaved wall to wall, creating a large, ominous form that seems like threads of a cloth loosened and falling apart.

Response
- 2023 · Longlisted for the Information is Beautiful awards
- 2023 · Showcased in the exhibition — Subjective Objects — held at the London College of Communication