Hajj Real-Time Operations Dashboard
Each year, over 2 million pilgrims gather for Hajj, placing immense pressure on infrastructure, safety systems, and operational coordination.
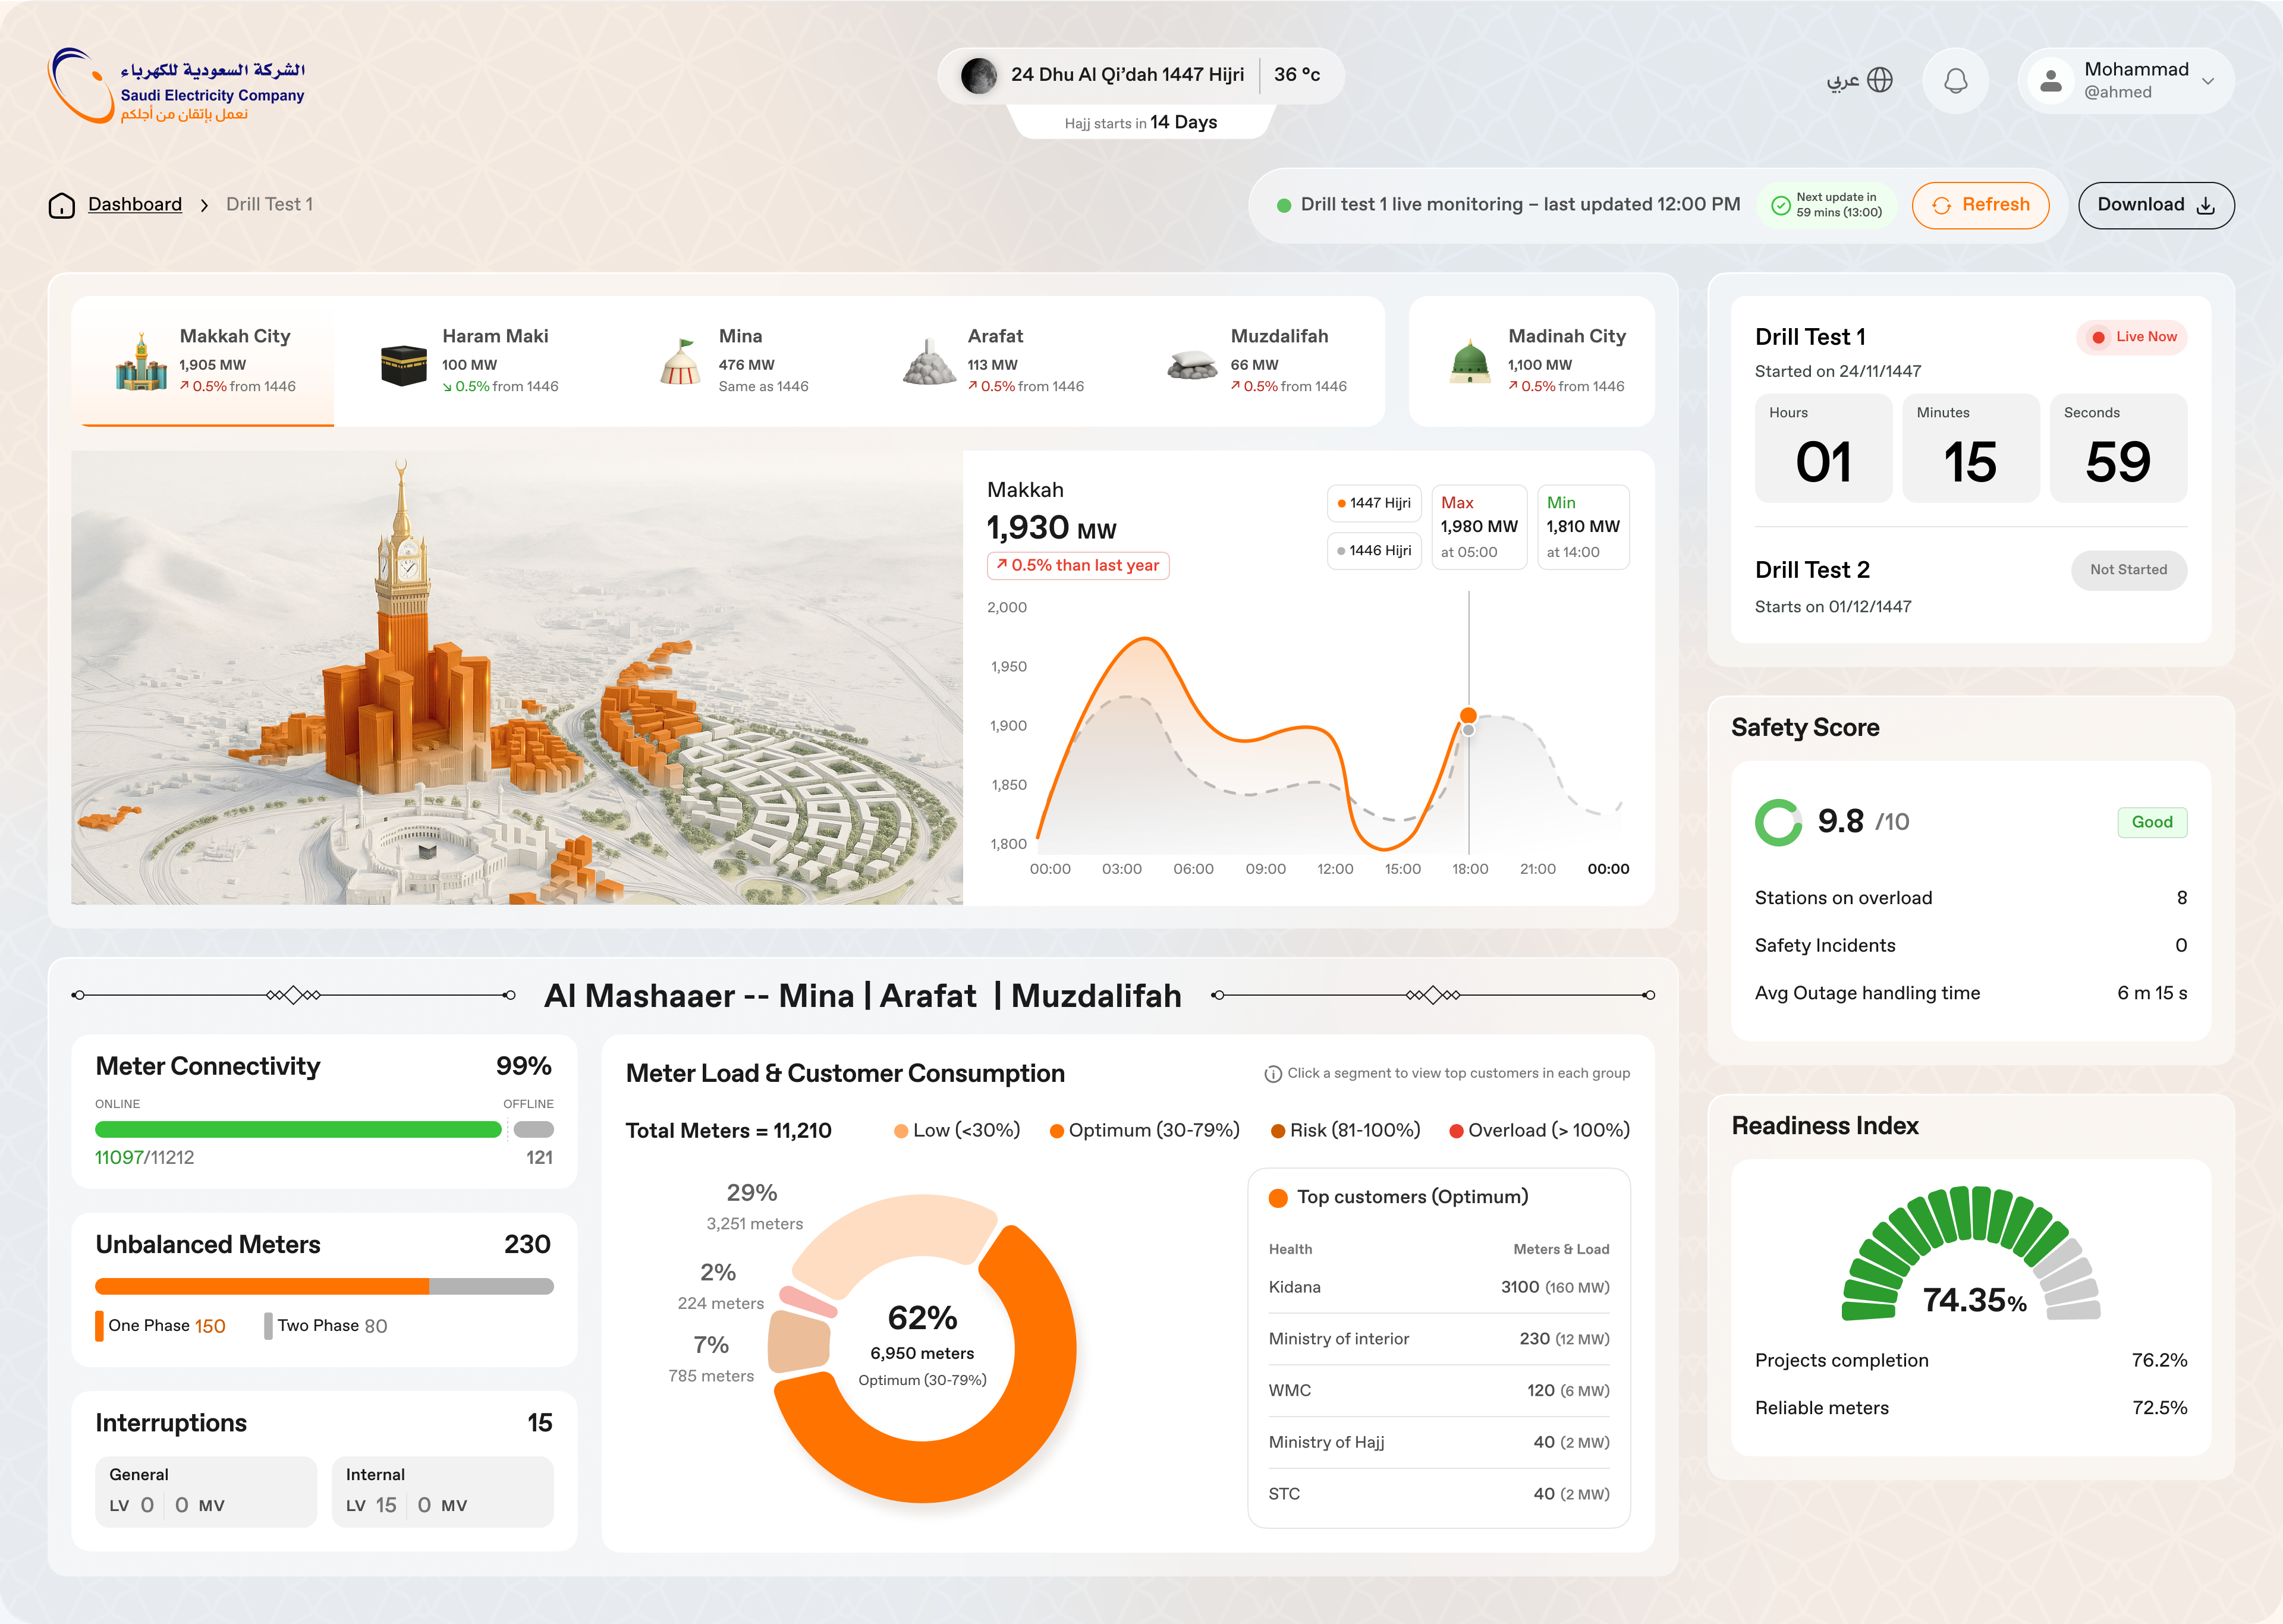
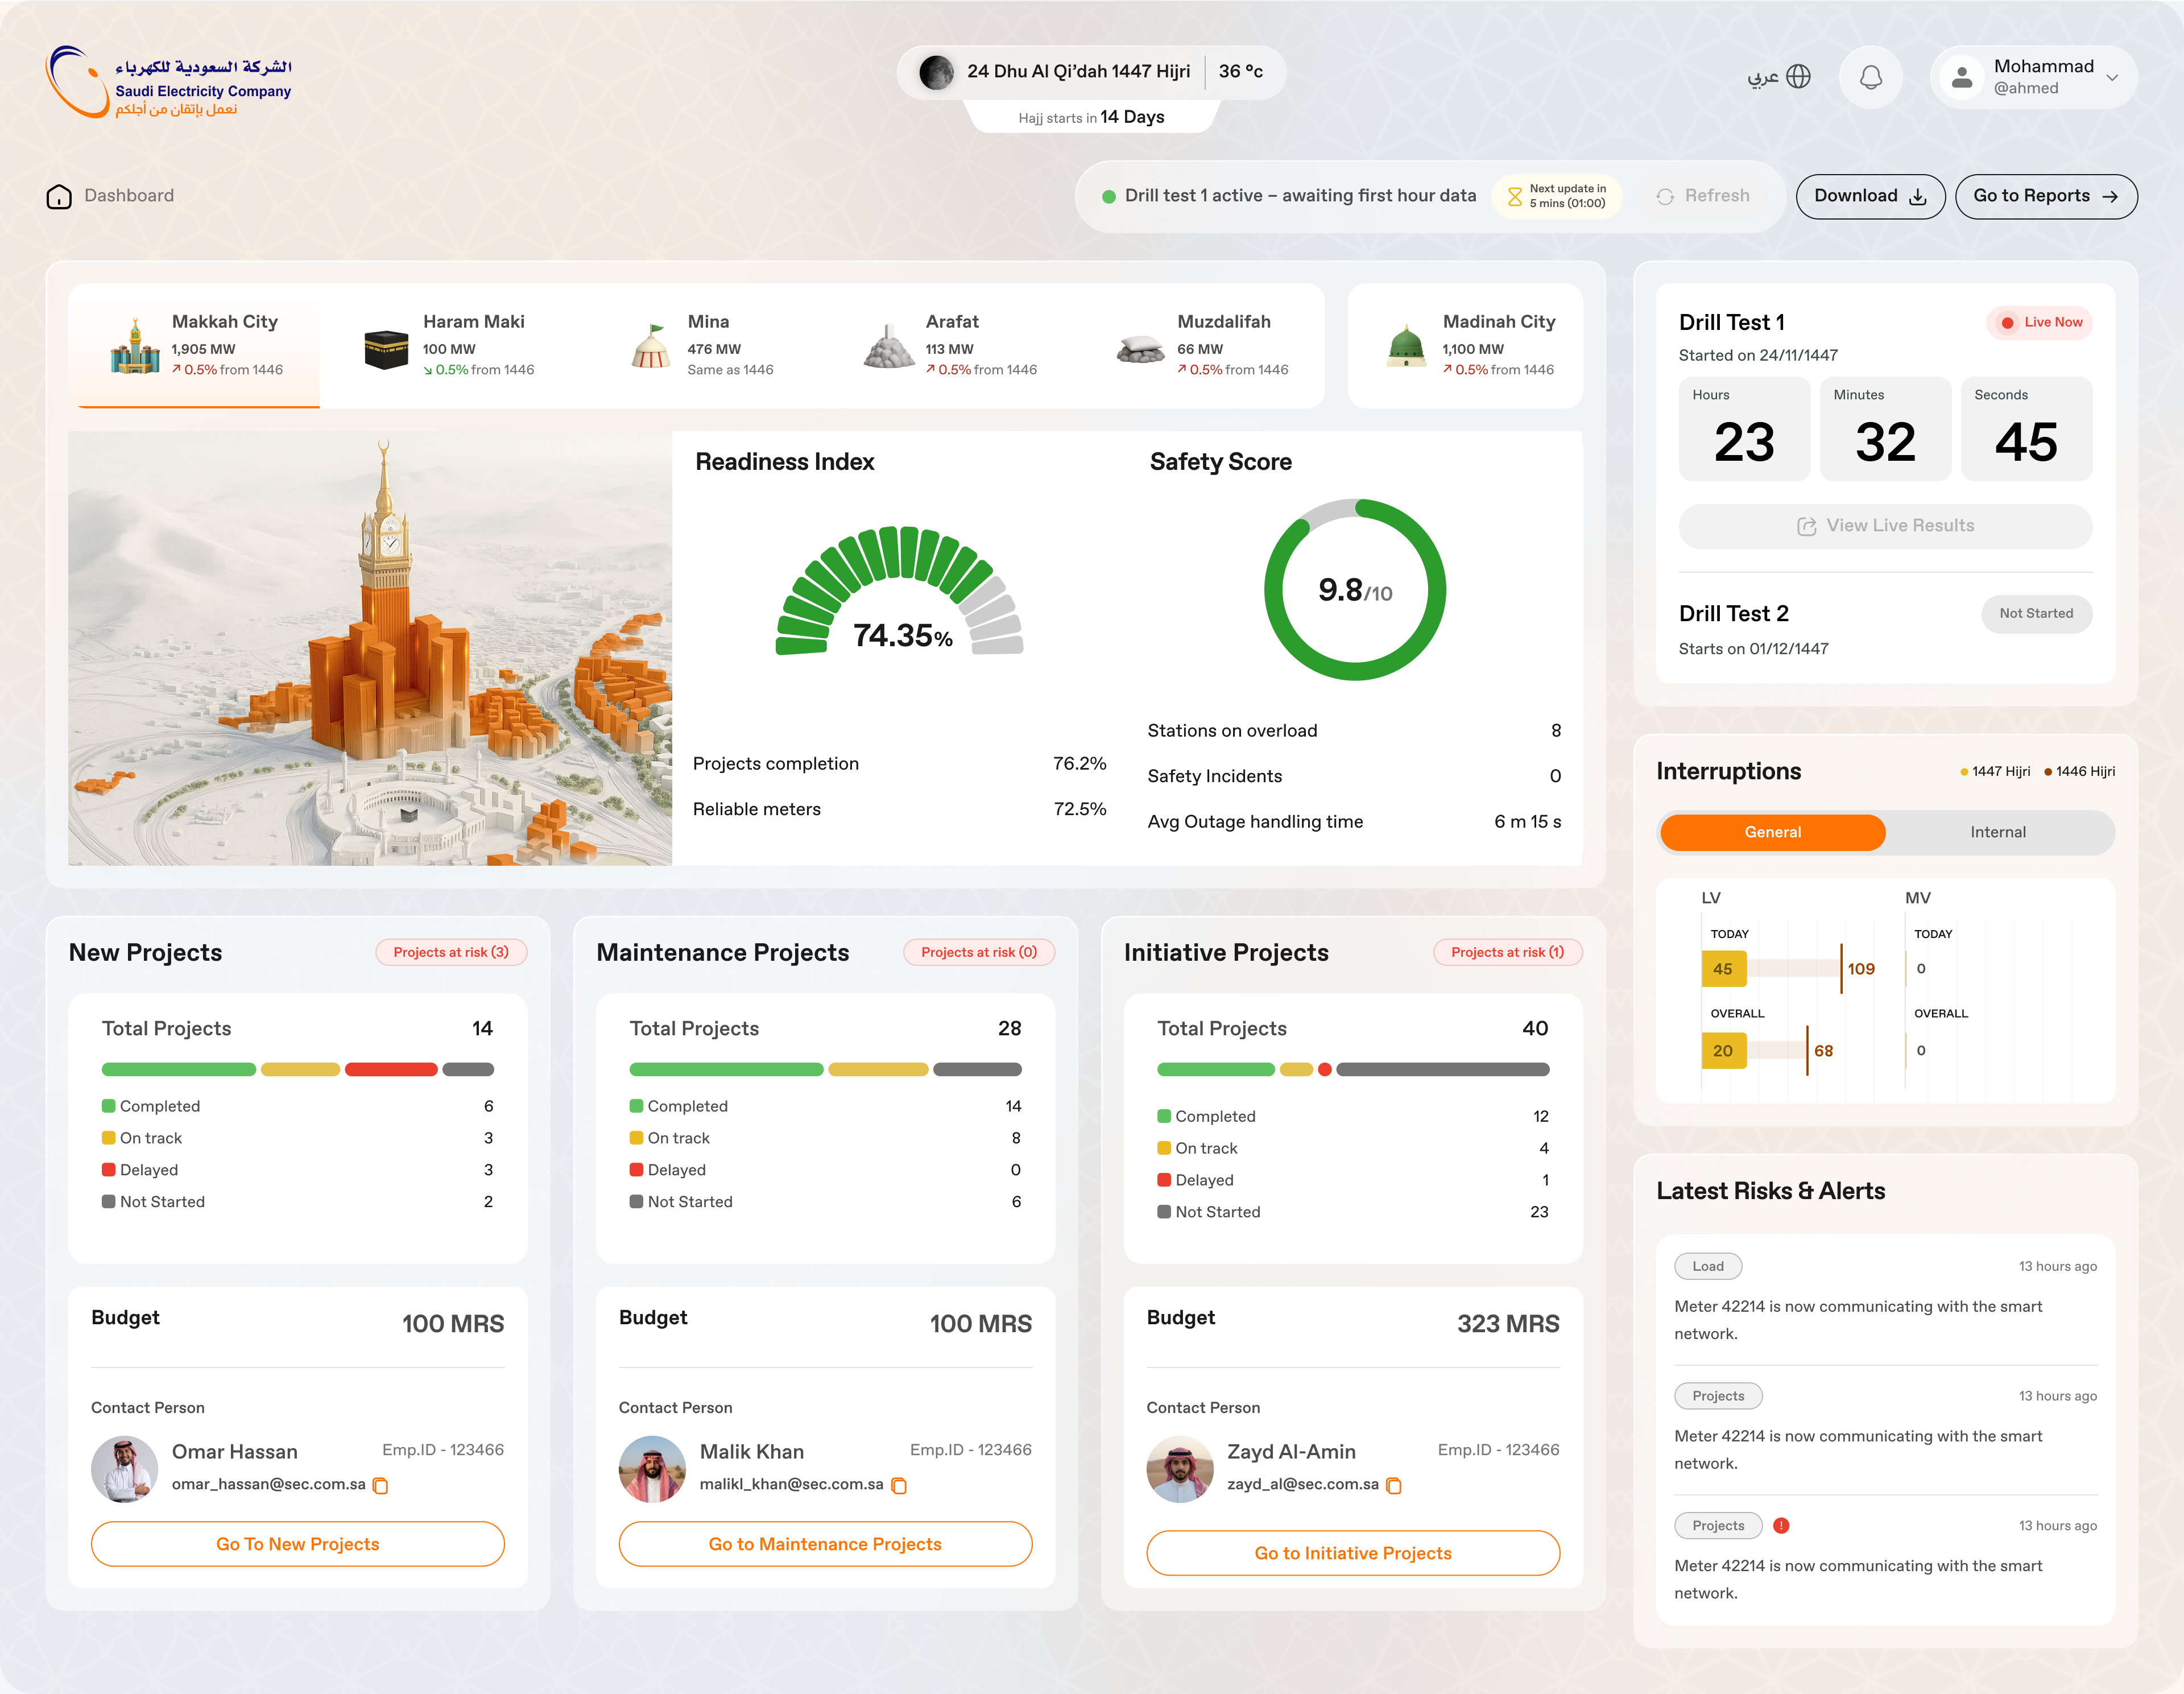
I contributed to shaping a real-time operations dashboard for Saudi Energy, the country’s primary electricity provider, bringing together fragmented data into a unified, decision-ready system.
I worked across UX and data visualisation, with a primary focus on translating complex operational data into clear, actionable interfaces for leadership and on-ground teams.
The proposed system moves teams from piecing together fragmented reports to working from a shared, real-time understanding of operations.
Understanding the System and Gaps
We gathered an understanding of how operational data was being generated, shared, and used across teams. Multiple stakeholders were involved including Saudi ministries, transport and medical services, as well as internal teams responsible for grid operations and maintenance.
Each function operated independently, with information distributed across spreadsheets, internal platforms, and informal channels, without a consistent structure or shared source of truth. Critical signals such as grid readiness, outages, and issues on-ground were spread across disconnected sources. These workflows also shifted during different phases of Hajj operations — from preparation and readiness, to live coordination during the event, and post-event reporting — with changing data needs at each stage.
While leadership depended on this information to make decisions, visibility was fragmented and there was no clear ownership of data.
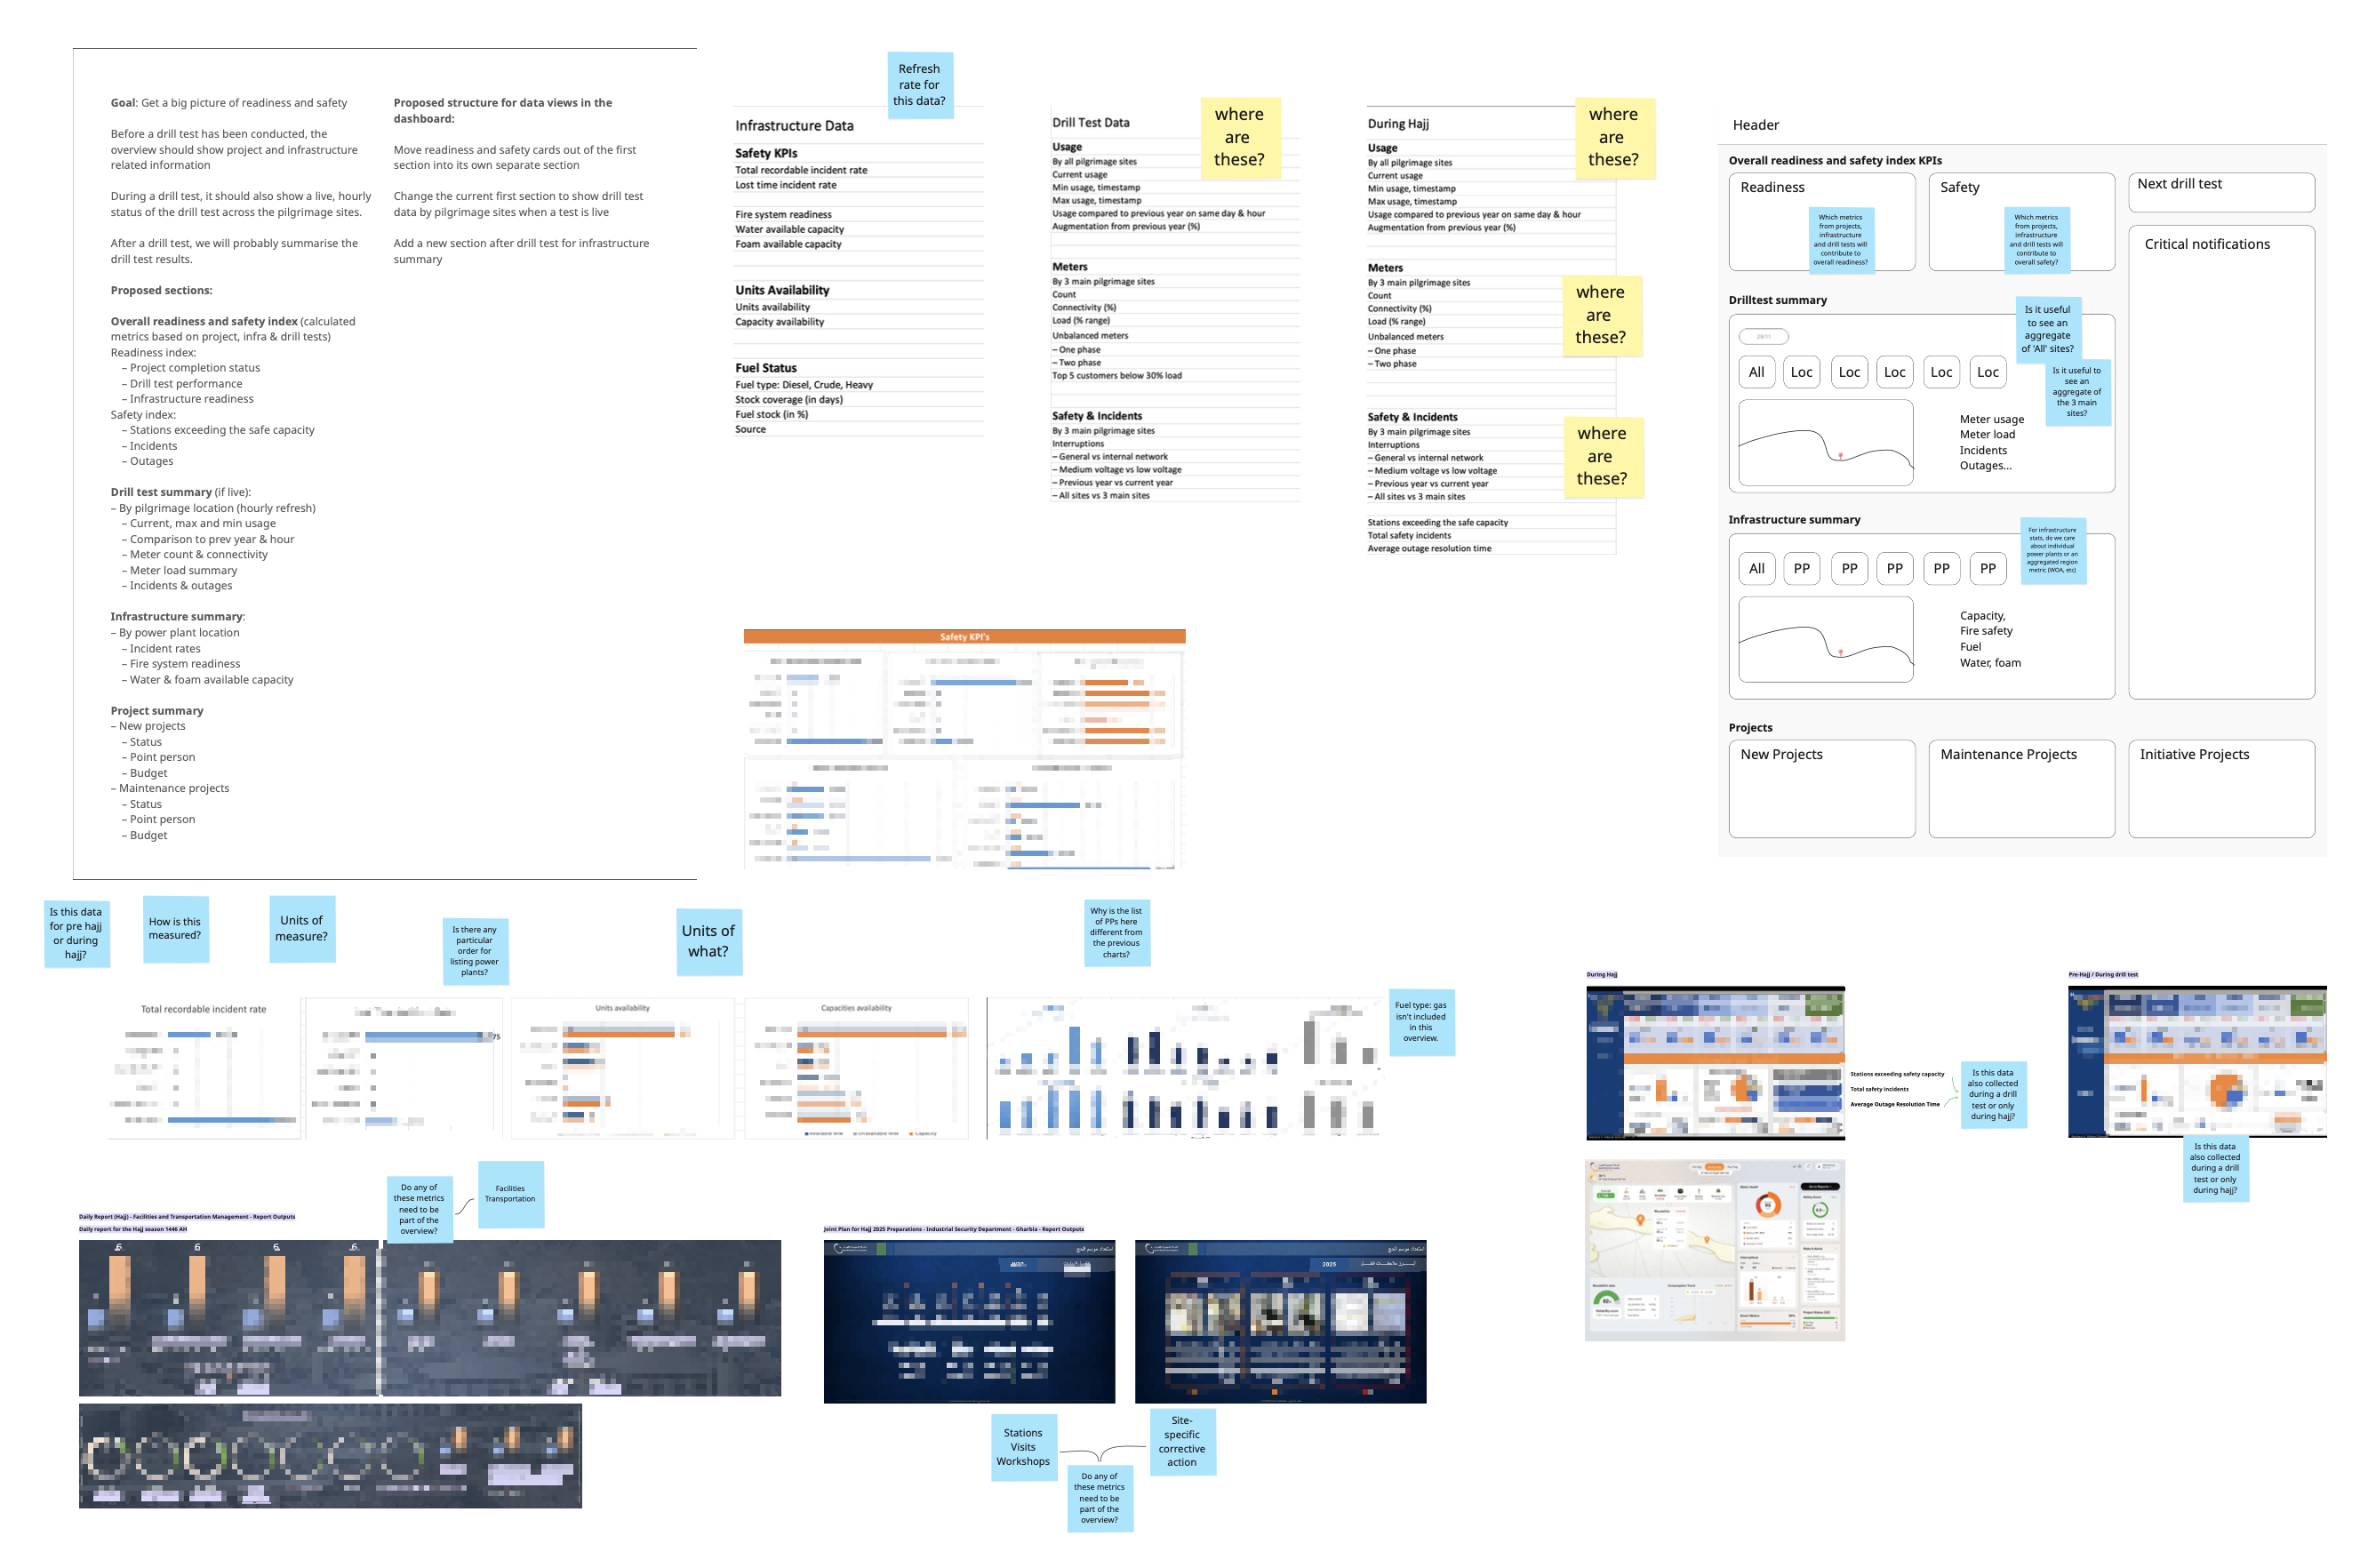
We also looked at the structural gaps: information lacked consistency, there was no shared understanding of key metrics, and critical updates required manual consolidation. As a result, building a complete and reliable picture of system readiness or incidents required piecing together inputs from multiple sources, making it difficult to reconcile, interpret and act on information in real time.
Understanding Users and Decision Flows
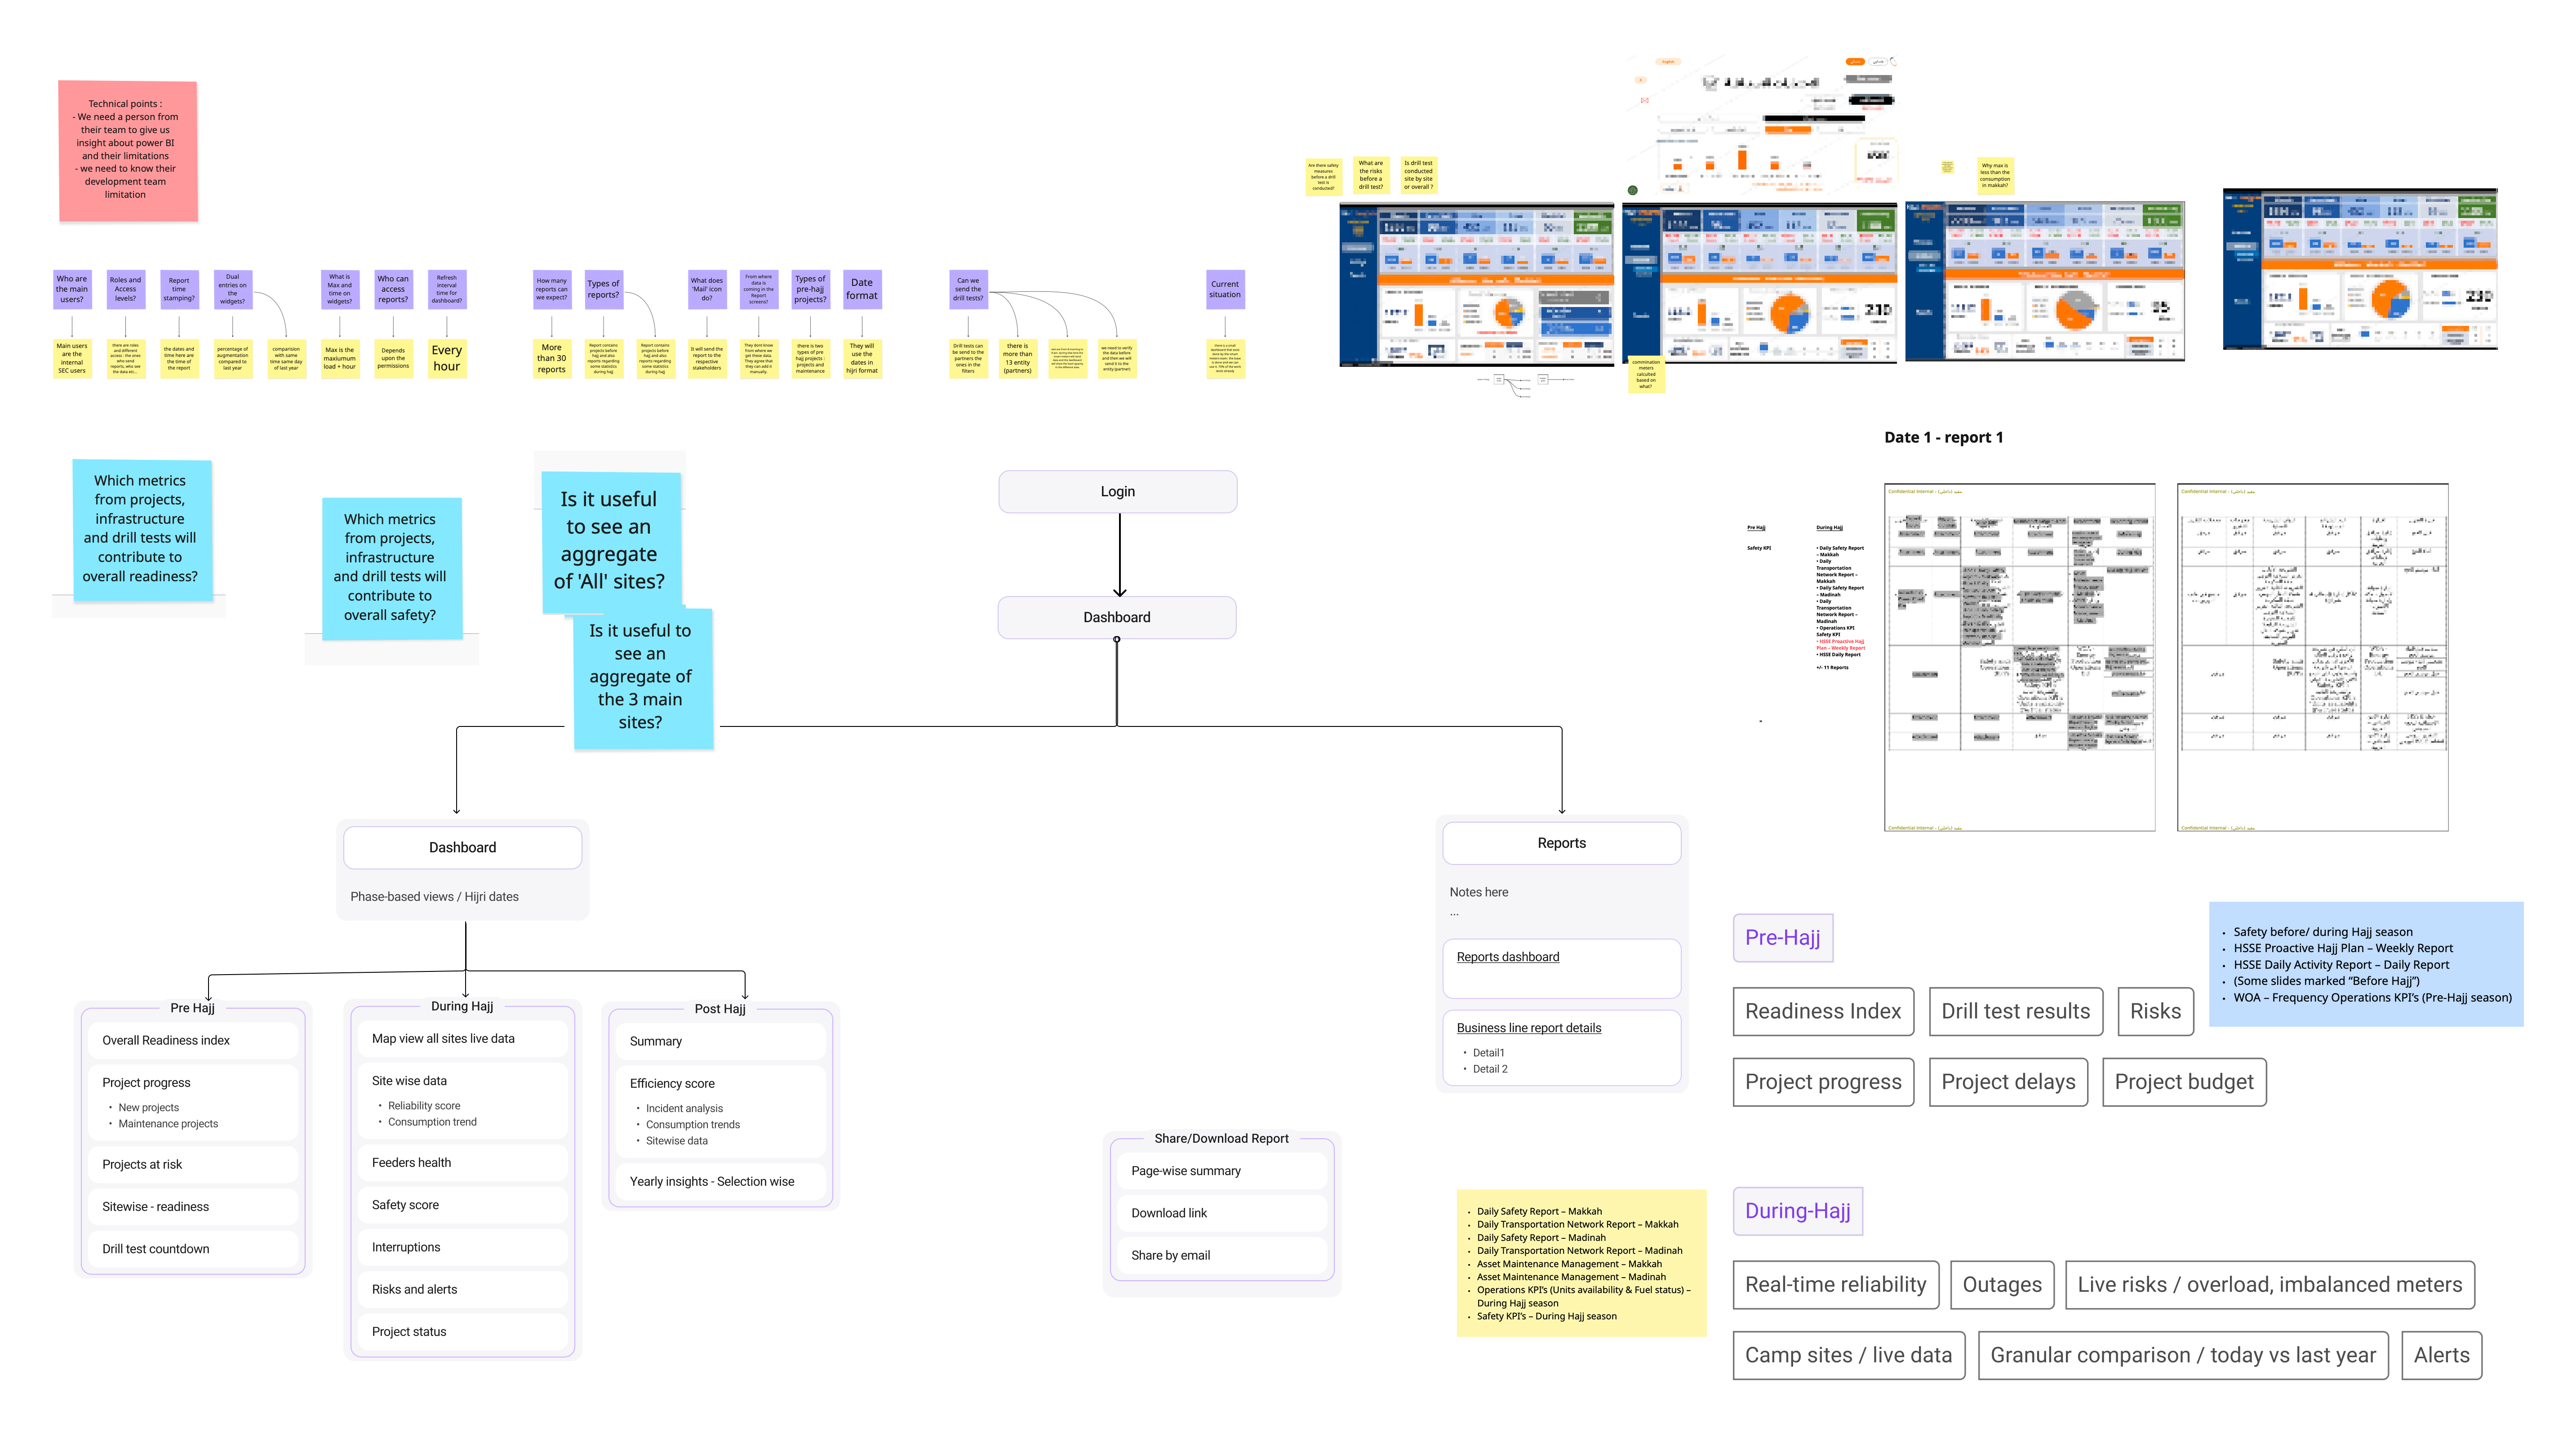
With a clearer understanding of how the system operated, the next step was to look at how information was being used to make decisions.
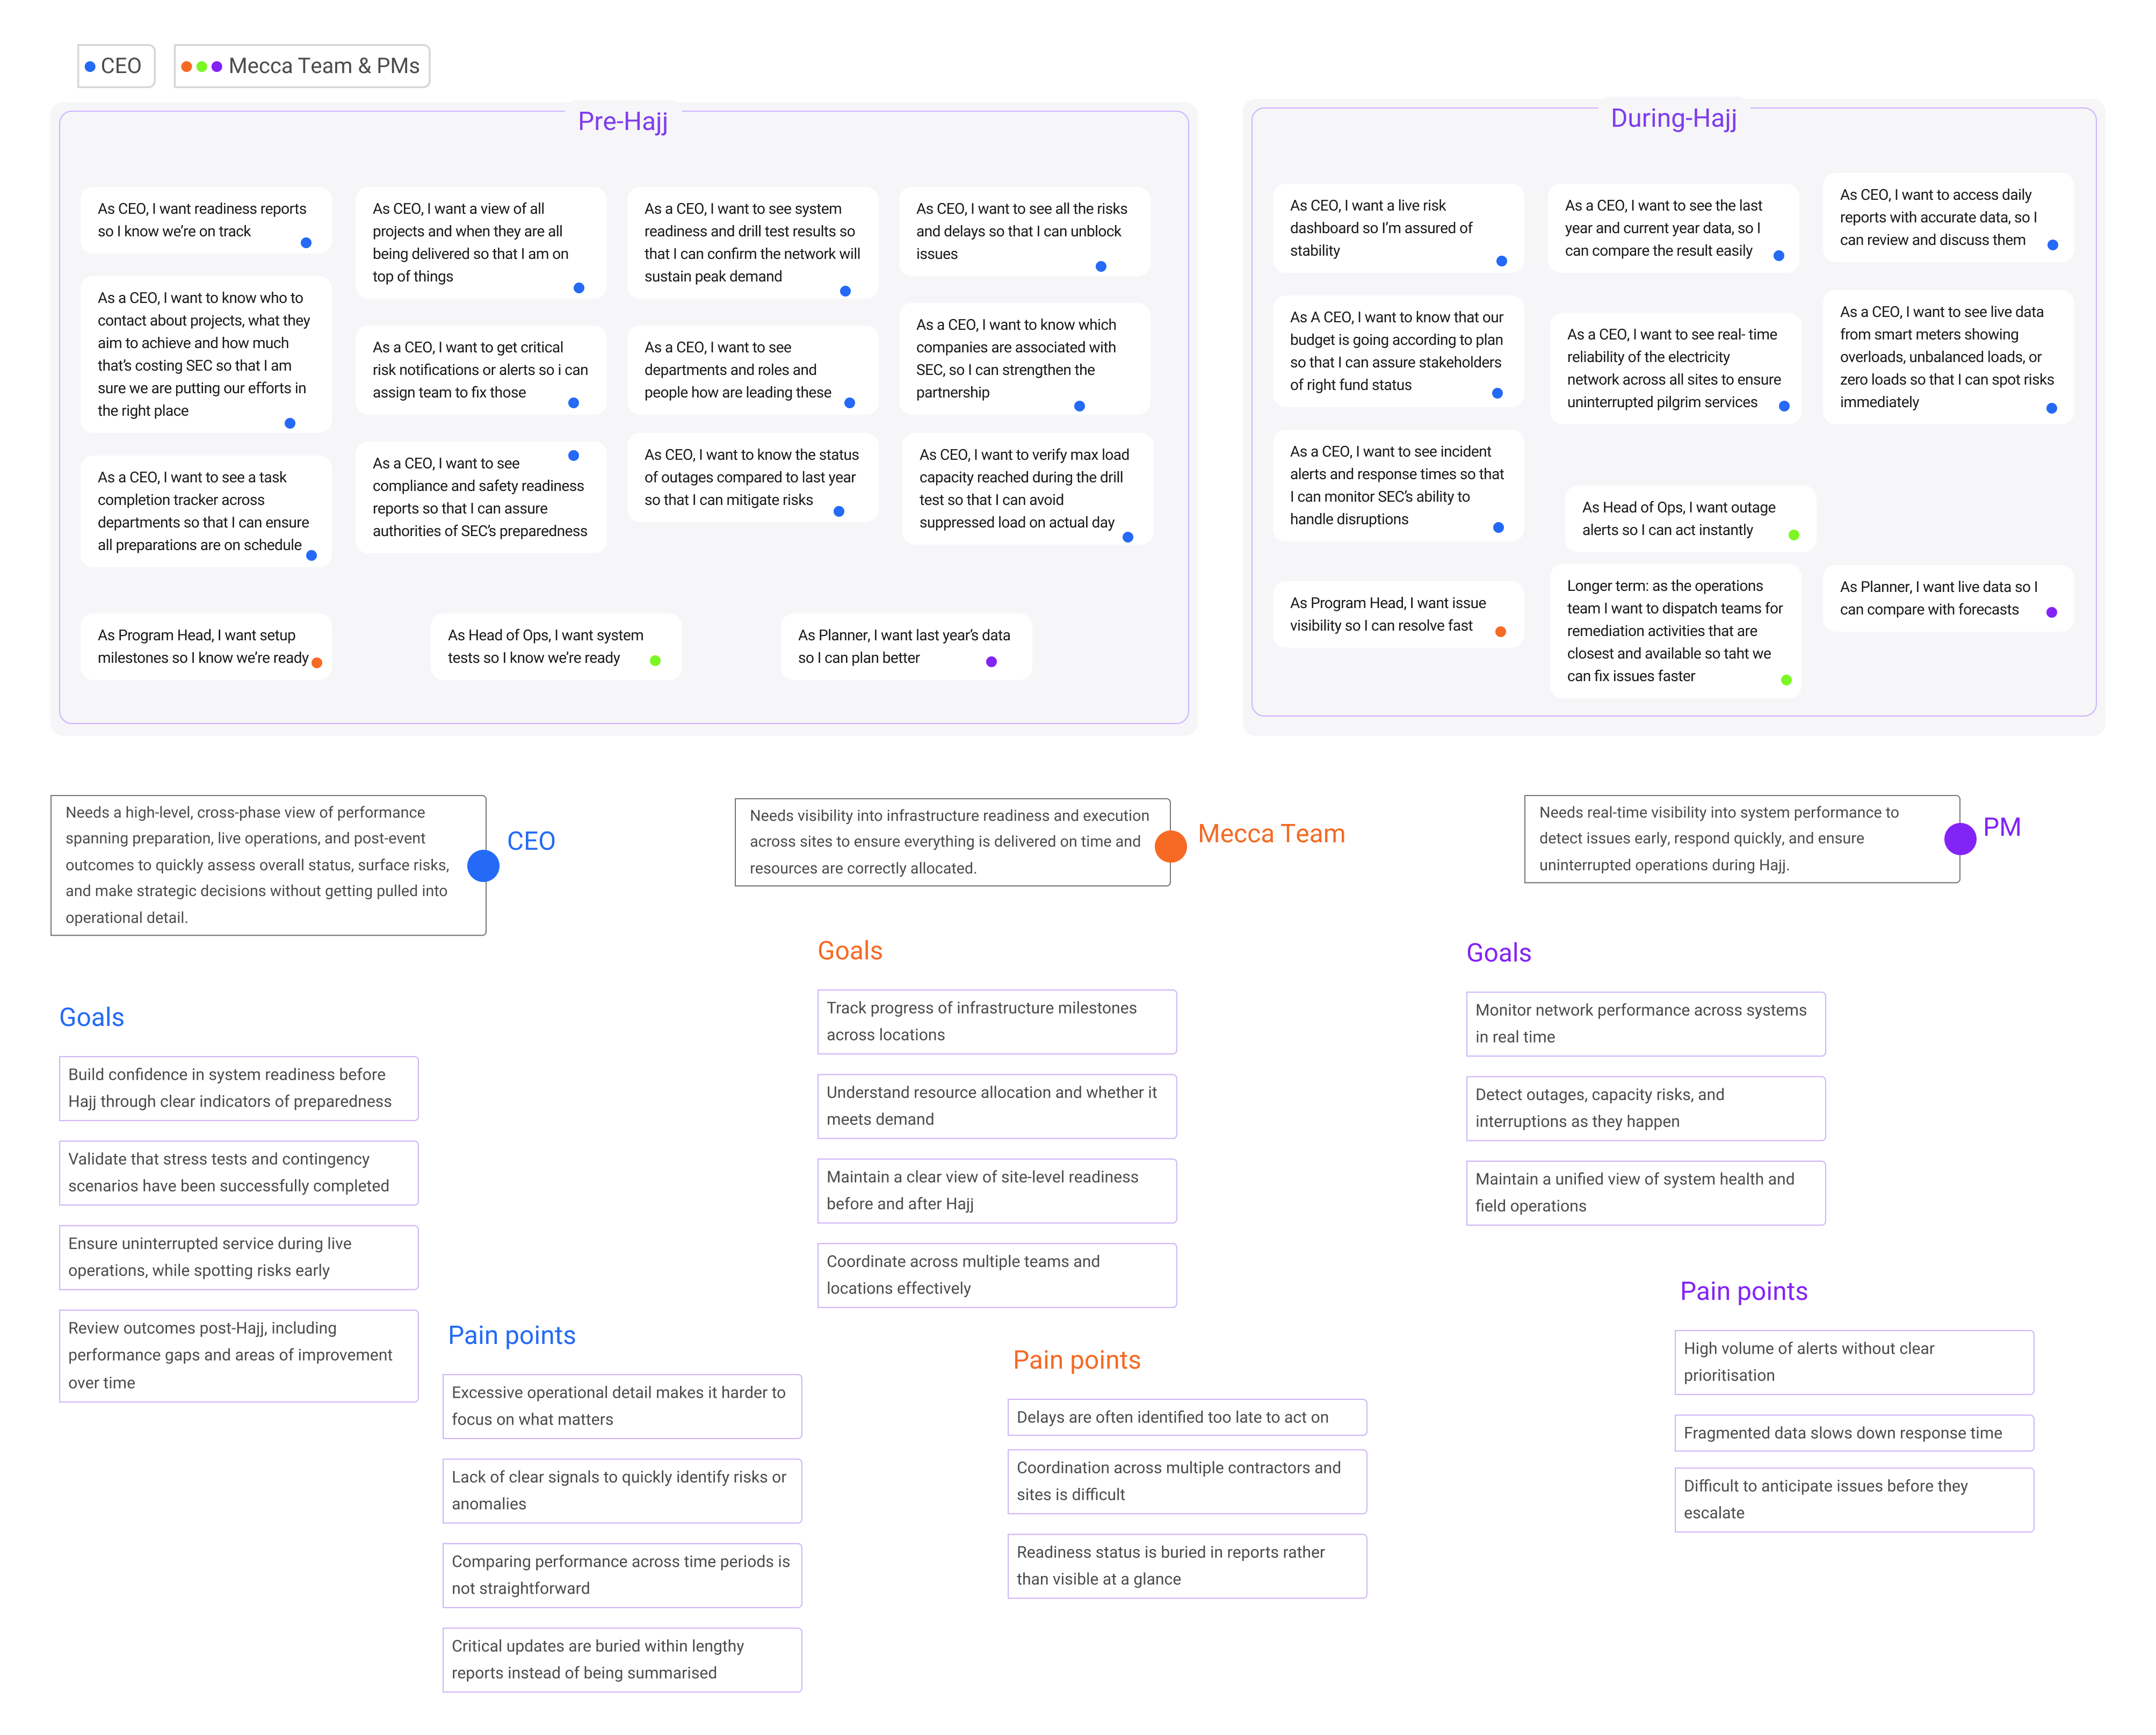
The dashboard needed to support multiple stakeholders, each working at a different level of the system. Leadership teams were focused on understanding overall readiness and identifying risks across sites. Operations teams required real-time visibility into outages, system load, and on-ground incidents. Program managers needed to track progress across initiatives and ensure accountability across teams.
These needs were closely tied to the different phases of Hajj operations. The information required before the event — centred around readiness and planning — differed significantly from what was needed during live operations, where speed and clarity was critical.
We clarified what each group needed to see, understand, and act on at any given moment. This shaped how information needed to be structured, allowing users to move from high-level signals to more detailed views depending on their role and context.
Considerations
The system had to be developed within a constrained environment owing to government data security restrictions, no API access between systems, and reliance on legacy tools. These conditions shaped how data could be structured, updated, and presented across the dashboard.
Impact
The system was rolled out for Hajj 2026, supporting coordination across multiple teams during a live, high-stakes operational environment. Leadership teams were able to monitor overall readiness and risks more clearly, while operations teams gained faster access to critical information during live incidents. It also established a more consistent way of structuring and accessing data across phases and laid the groundwork for continued use and iteration in future cycles.
- Client: Saudi Energy and Horizontal Digital
- Role: UX & Data Visualisation Consultant