HotPlot
- Computational Design ·
- Creative Technology ·
- Tools
If you've used an AxiDraw or NextDraw for a while, you've probably spent some time on the Inkscape plugin. For a long time that is how I controlled my pen plotter. It is open source and widely used, which is great, but in practice I’ve never enjoyed working with it.
Inkscape is slow, the plugin workflow feels clunky, and the whole process of preparing a file, exporting it, and sending it to the machine just has too much ceremony. Most of what I plot doesn't start in a vector editor anyway. I usually write code to generate the visuals, run a script to produce the SVG, and then — to talk to the plotter — drag the file into Inkscape, adjust layers, fix scaling, and run the plugin. This was far from being frictionless.
Working with generative SVG also introduces its own problems. Exporting SVG from p5.js tends to produce paths that are far too complex with dense point lists and long path strings. The file may very well look fine on screen but the structure underneath makes plotting unreliable or sluggish. Before anything is sent to the machine, there's usually another round of simplifying paths, reorganising layers and cleaning things up.
After having had enough of that, I decided to just address the tooling problem.
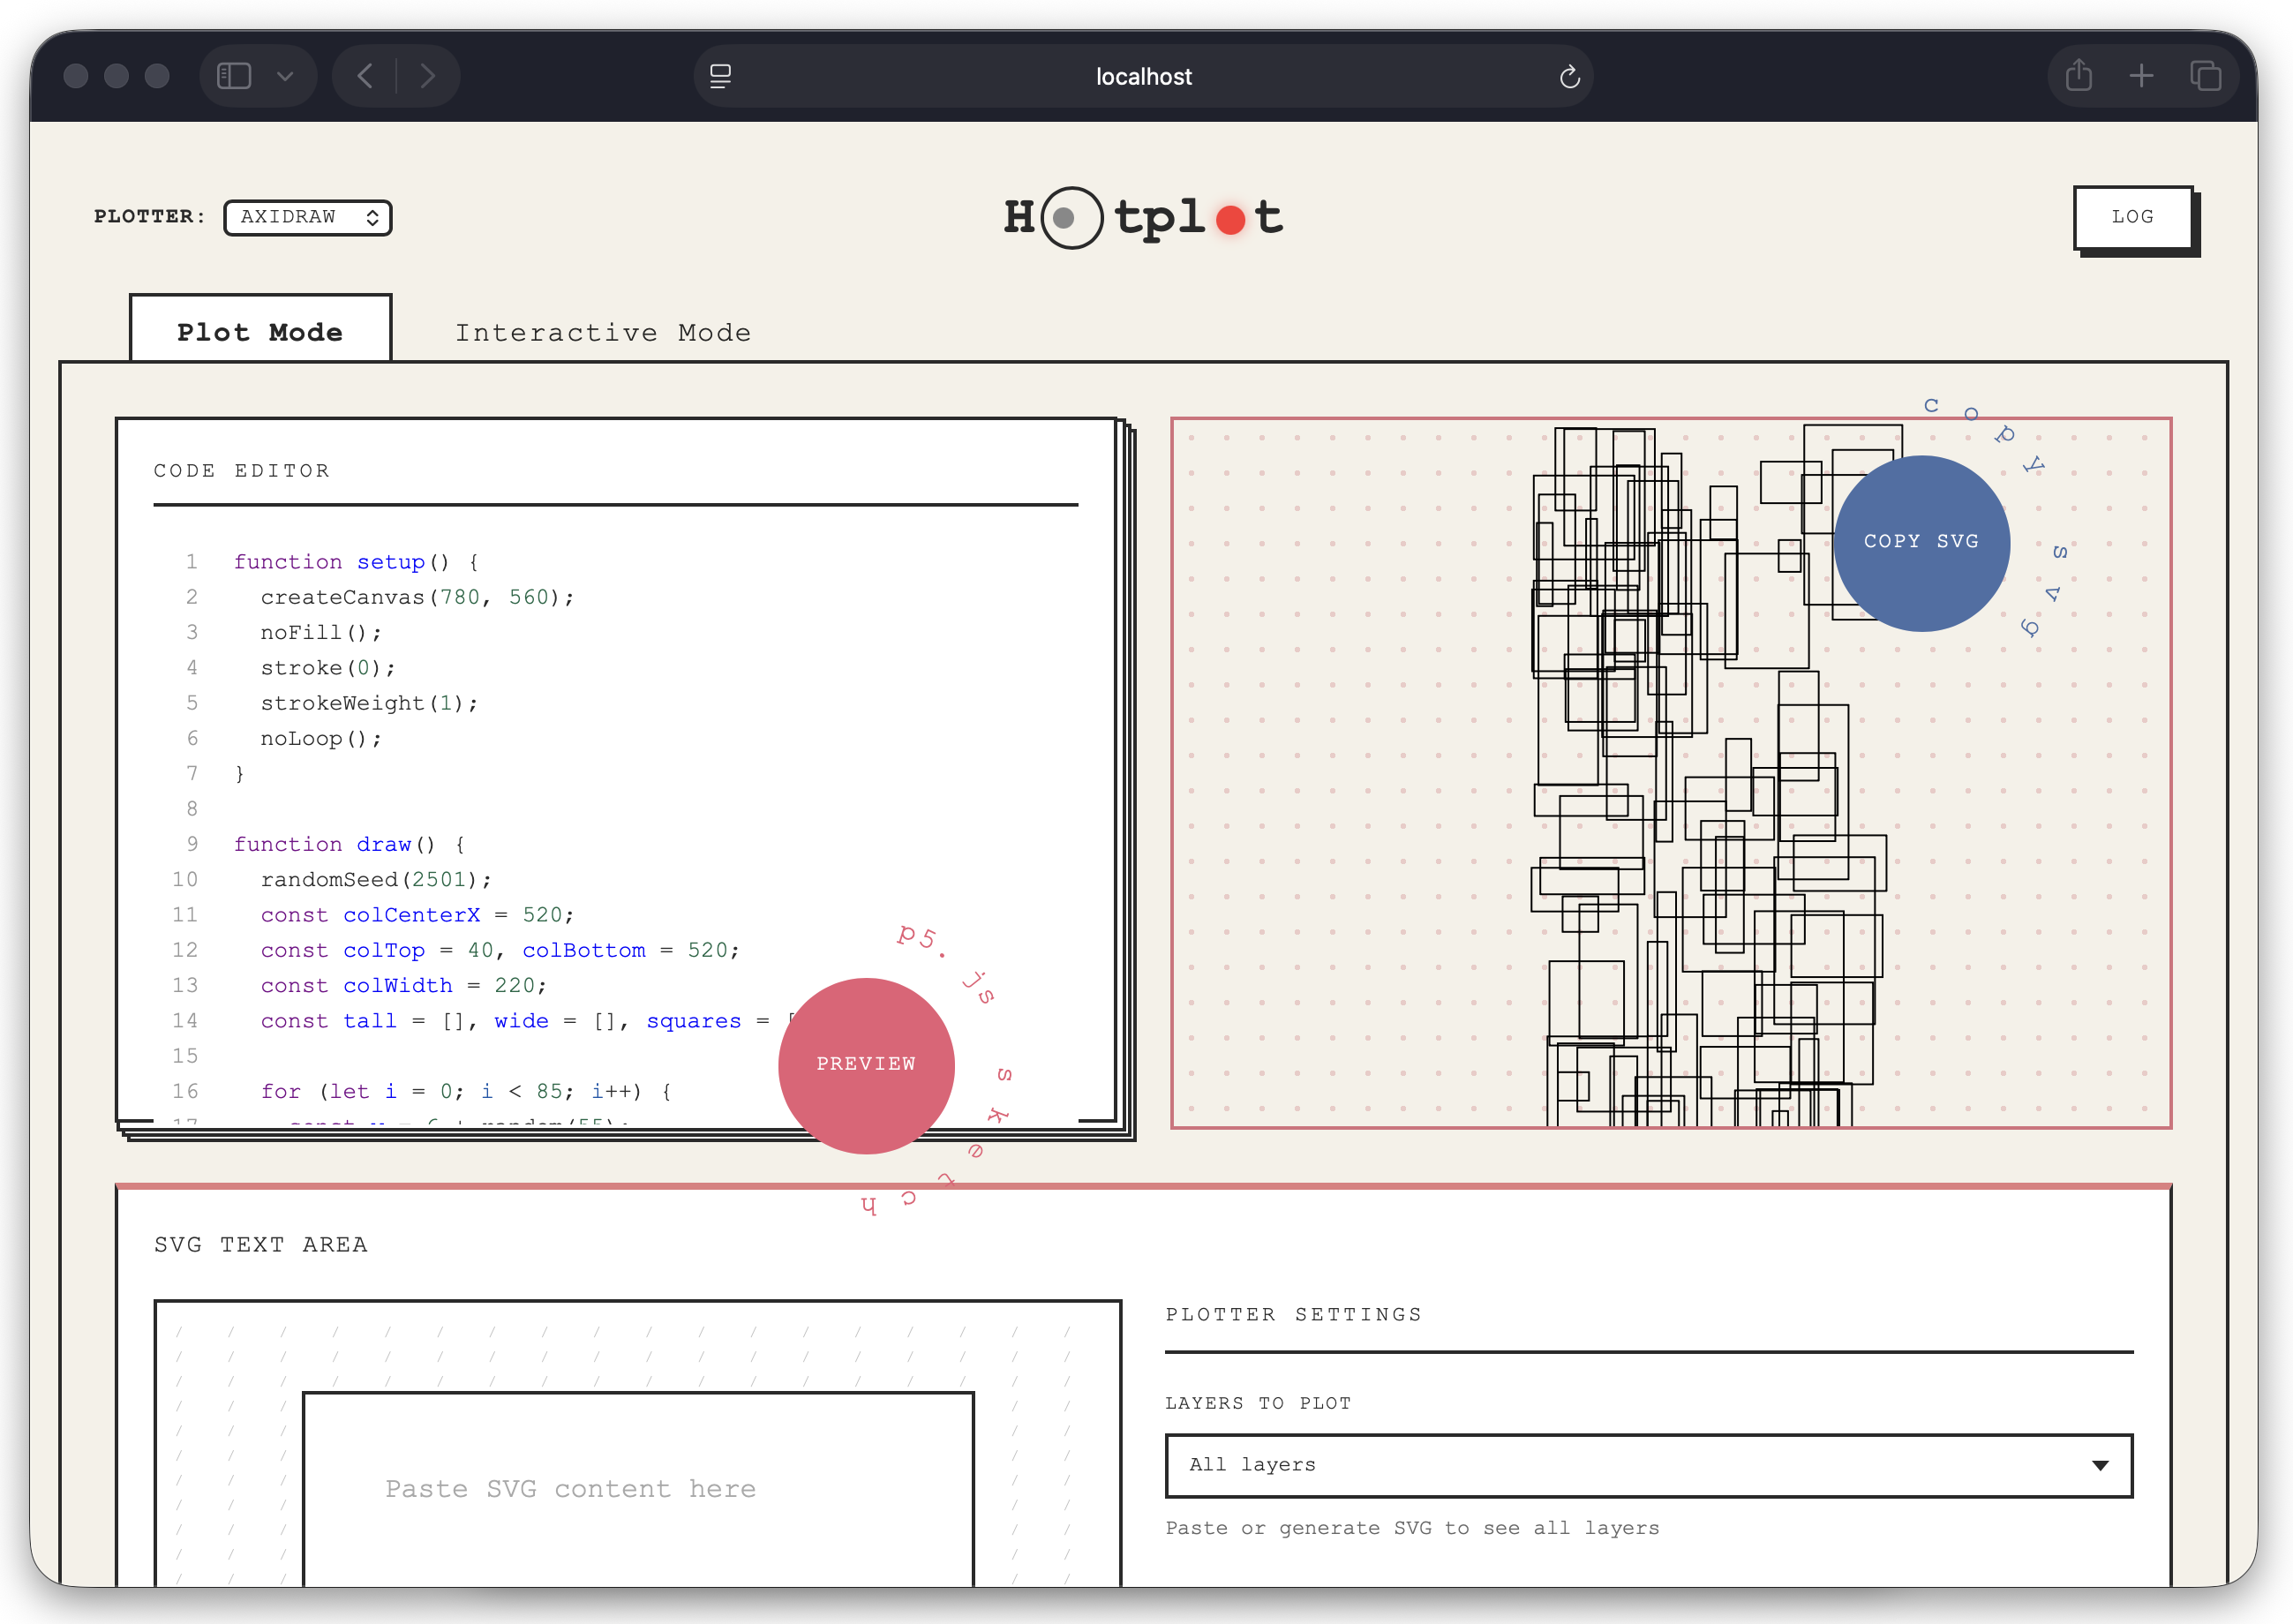
HotPlot is a small app that runs locally in the browser and pulls these fragmented pieces of the workflow together. You can write and preview generative sketches, inspect the SVG that gets produced, and send it directly to an AxiDraw or NextDraw. It also includes a small interactive command interface so you can jog the plotter, test carriage movements, or issue commands without opening the CLI or yet another tool.
In the rest of this post, I’ll walk through how the tool works, how the interface came together, how I got Cursor to assist me through clearly written specifications and plan documents, along with a dedicated UI playground to explore visual variations.
Working with Cursor: Specs, Plans, and Guardrails
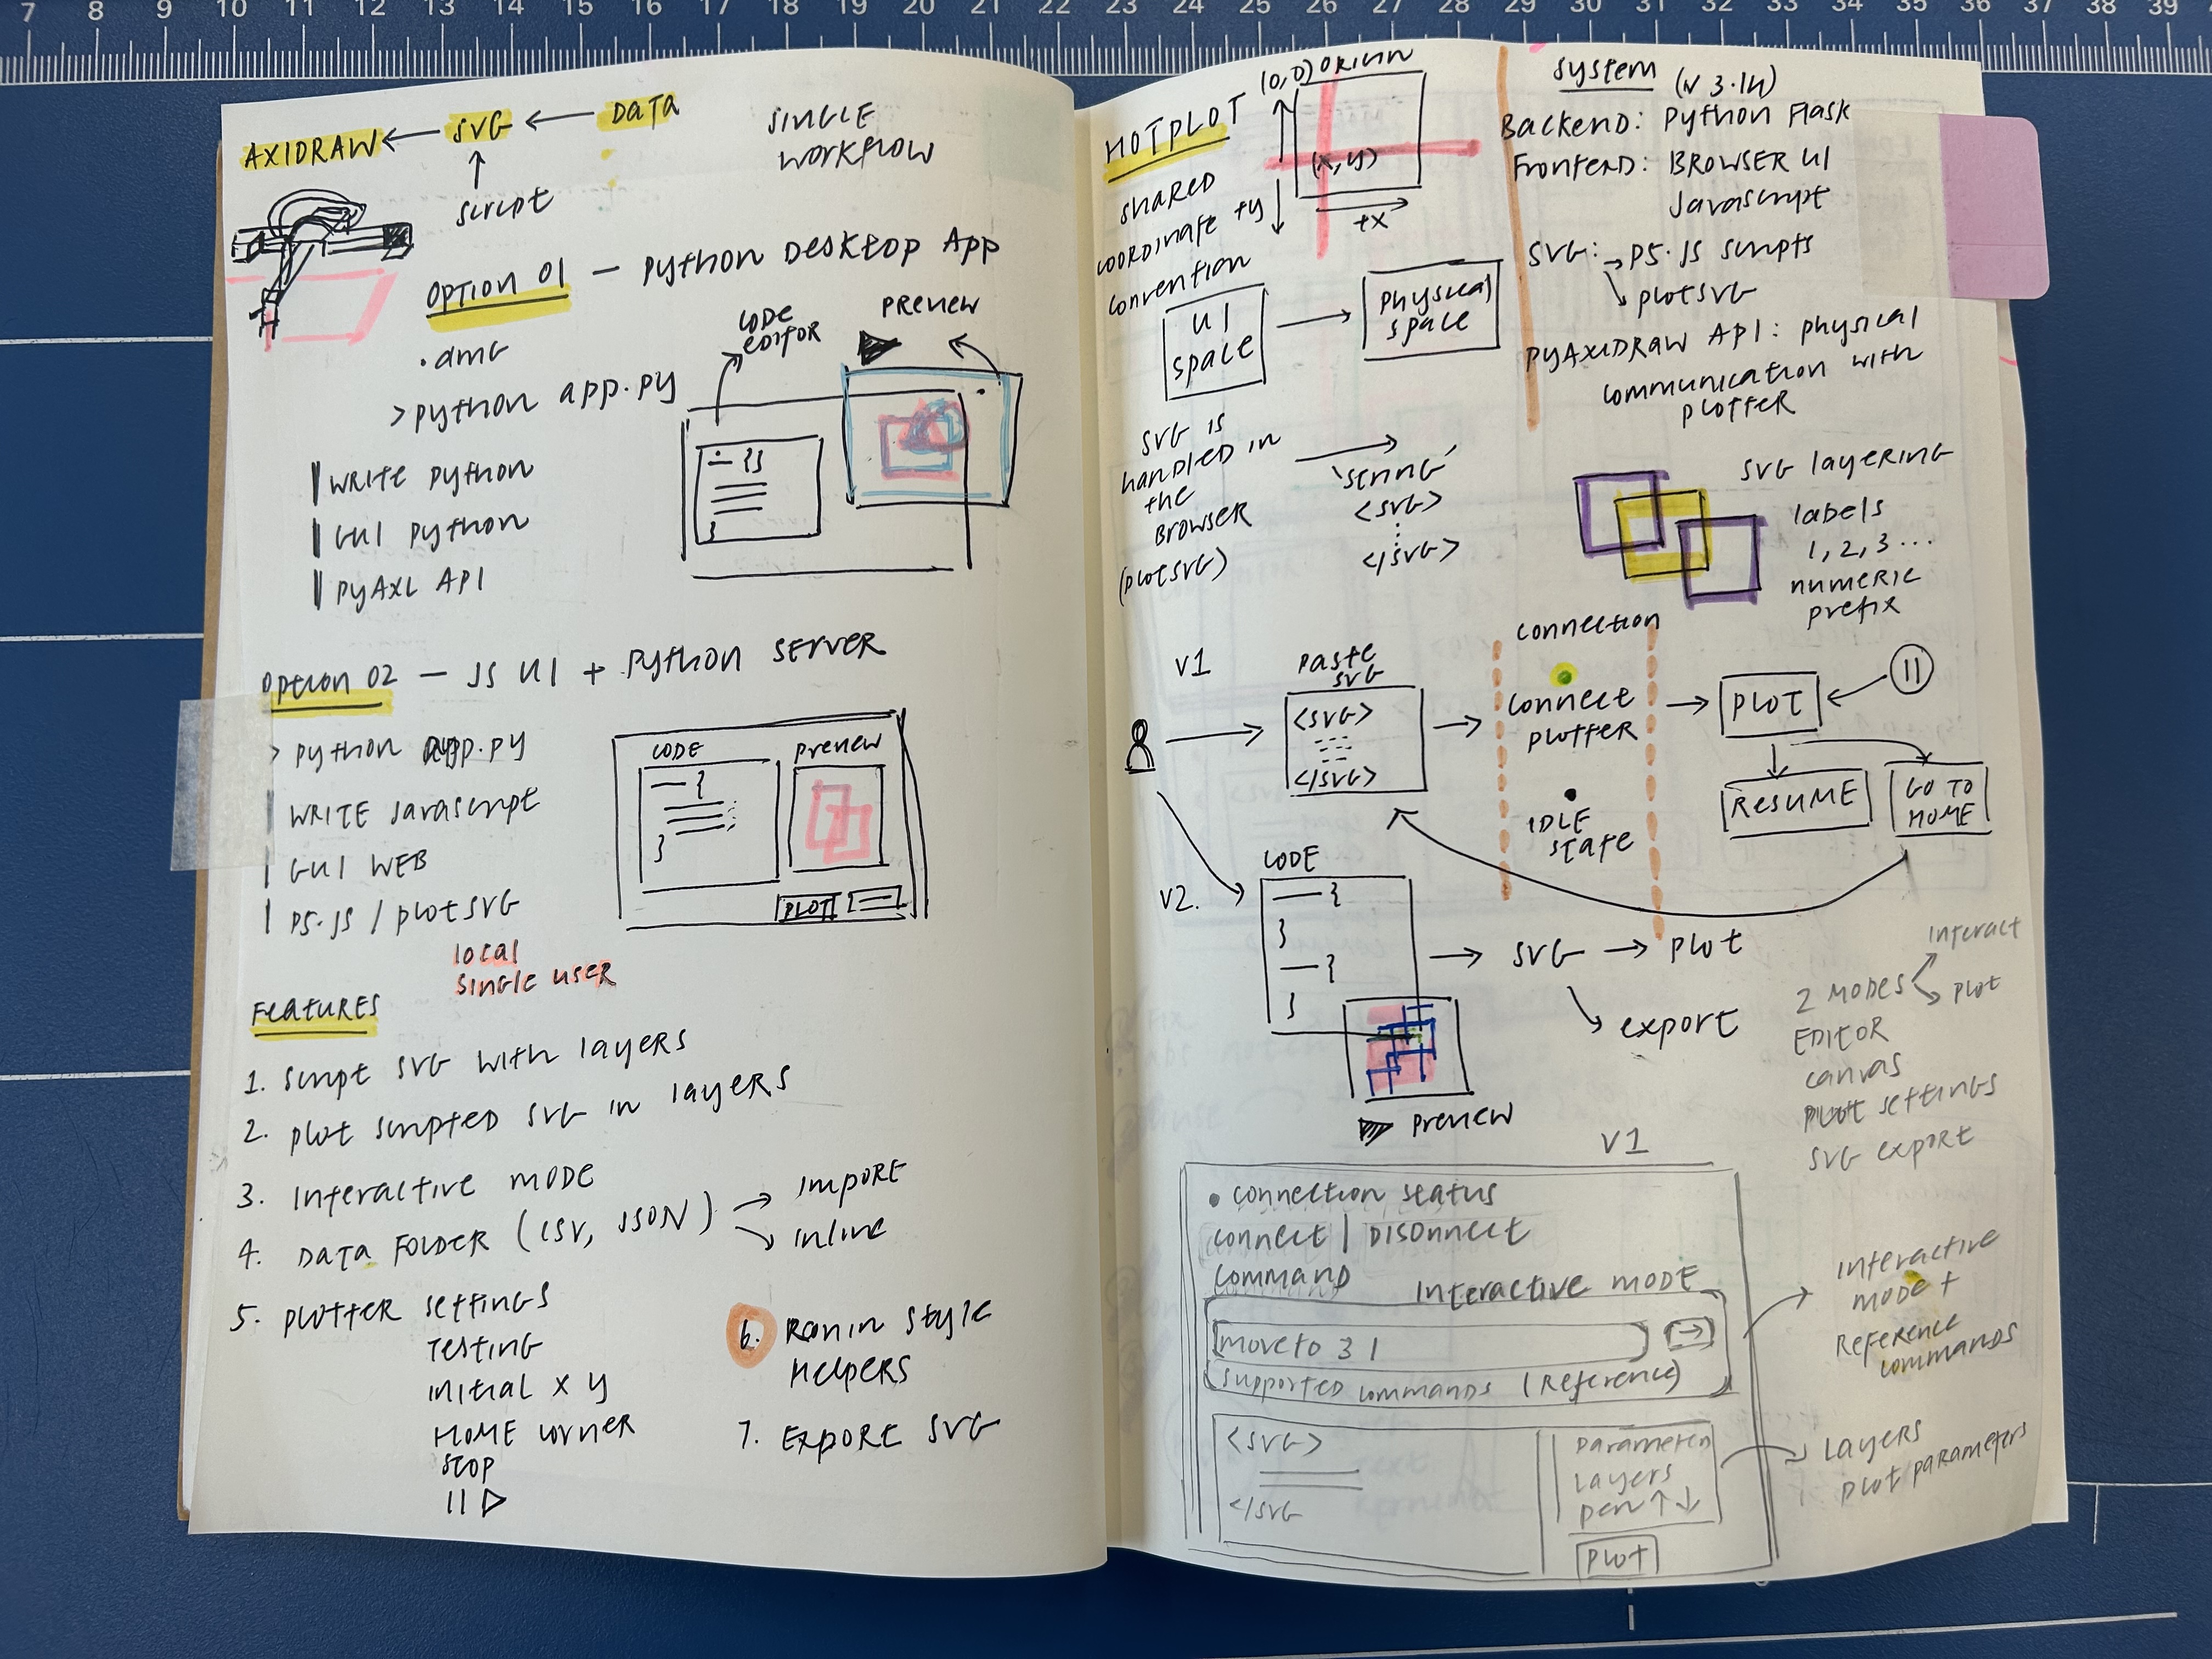
The main thing I did early on was write a spec document. There’s a SPEC.md markdown file in the repository that describes in fairly good detail what HotPlot
does, what it doesn’t do, and how the core pieces behave. I listed out the core
capabilities of the tool, SVG conventions, how layers map to SVG, backend architecture,
and also some code philosophy. It was meant to be a single place where the intended
behaviour of the tool and rules were captured. In practice, this was pretty useful.
The spec document effectively became the source of truth for how the system should
behave.
For larger pieces or features, I also wrote short plan documents before touching any code. Usually just a page describing what the feature was meant to do, which parts of the codebase it should touch, and how it should fit into the existing structure. Writing the plan was often more useful than the document itself because it helped me to think the problem through before asking Cursor to implement anything. It also cuts down on the back-and-forth and the implementation tends to be more closer to the target on the first pass.
I also use Cursor to read through code and understand my dependencies. For instance, I used the p5.plotSvg library for grouping and managing SVG layers. As this is a fairly new tool, I asked Cursor to read through the code to understand the available functionalities. A huge shout-out to Golan Levin for his work on the library and for making it open source.
The last piece was a small set of Cursor rules in .cursor/rules.
These are lightweight instructions scoped to particular files or parts of the
repository. For example, the p5.js sketches follow a specific convention for
how layers are grouped in the SVG output. I encoded this pattern once as a
rule so the model would preserve it when editing these files and avoid small
inconsistencies creeping in. Rules end up being a good place to encode project
and code conventions and nudge the AI toward my conventions. For example,
there’s a rule that applies when editing p5.js sketches: I ask it to use
beginSvgGroup and endSvgGroup for layers and not just
stroke color. That way the sketches stay plotter-friendly and layer-aware without
me having to say it every time.
I tend to start from the spec document (or update it if the scope changes), sketch a short plan for each feature, and then implement it incrementally. If Cursor suggests something that doesn’t line up with the spec, I point back to the spec and adjust.
Architecture at a Glance
At a high level, HotPlot has three main pieces: a browser-based interface, a lightweight Flask backend, and a thin adapter layer that lets the backend code talk to either an AxiDraw or a NextDraw pen plotter.
The browser side is where most of the drawing workflow lives. It runs as a single-page interface with a code editor, a preview canvas, an SVG inspection area, and a small REPL for sending commands directly to the machine. The frontend is written in vanilla JavaScript, with Alpine.js used for lightweight UI state management, and a mix of Tachyons and custom CSS for styling. Sketches themselves are written in p5.js, and p5.plotSvg is used to generate plotter-compatible SVG output from these sketches.
When the user clicks Plot, the frontend records the drawing as an SVG and sends that SVG string to the backend over a simple HTTP request. The backend receives the SVG and then passes it to the plotter API. HotPlot also accepts pasted SVG. Sometimes I already have an SVG and just want to inspect it, choose one or more layers, and send it to the machine for plotting.
On the backend side, HotPlot runs a small Flask application. It exposes a handful of endpoints for state, configuration, connecting and disconnecting, executing interactive commands, plotting SVG files, stopping a plot, and homing the machine.
The plotter has two different modes of use. There’s an interactive context for
jogging the machine and issuing commands like moveto, lineto, penup, pendown, and home. There’s a
plot context for running an SVG file. These two contexts are mutually
exclusive in the plotter API, so the app manages them explicitly.
Layering is handled entirely through named SVG groups. In the p5 sketches I
use
beginSvgGroup() and endSvgGroup() with names that begin
with a number: 1 black, 2 red, and so on. The backend passes
the chosen layer number through to the plotter API, which matches groups whose
names begin with that number. This makes multi-pen workflows infinitely
easier.
Between the backend and the hardware is a small plotter adapter module. AxiDraw and NextDraw provide very similar Python APIs, but have small differences between them such as initialisation steps, setup details, importing paths, and homing behaviour. These differences are abstracted behind an adapter module that creates the right plotter instance and smooths over the mismatches so the rest of the backend can interact with the plotter through a single consistent interface. All other logic and everything else in the app stays the same regardless of which machine is connected.
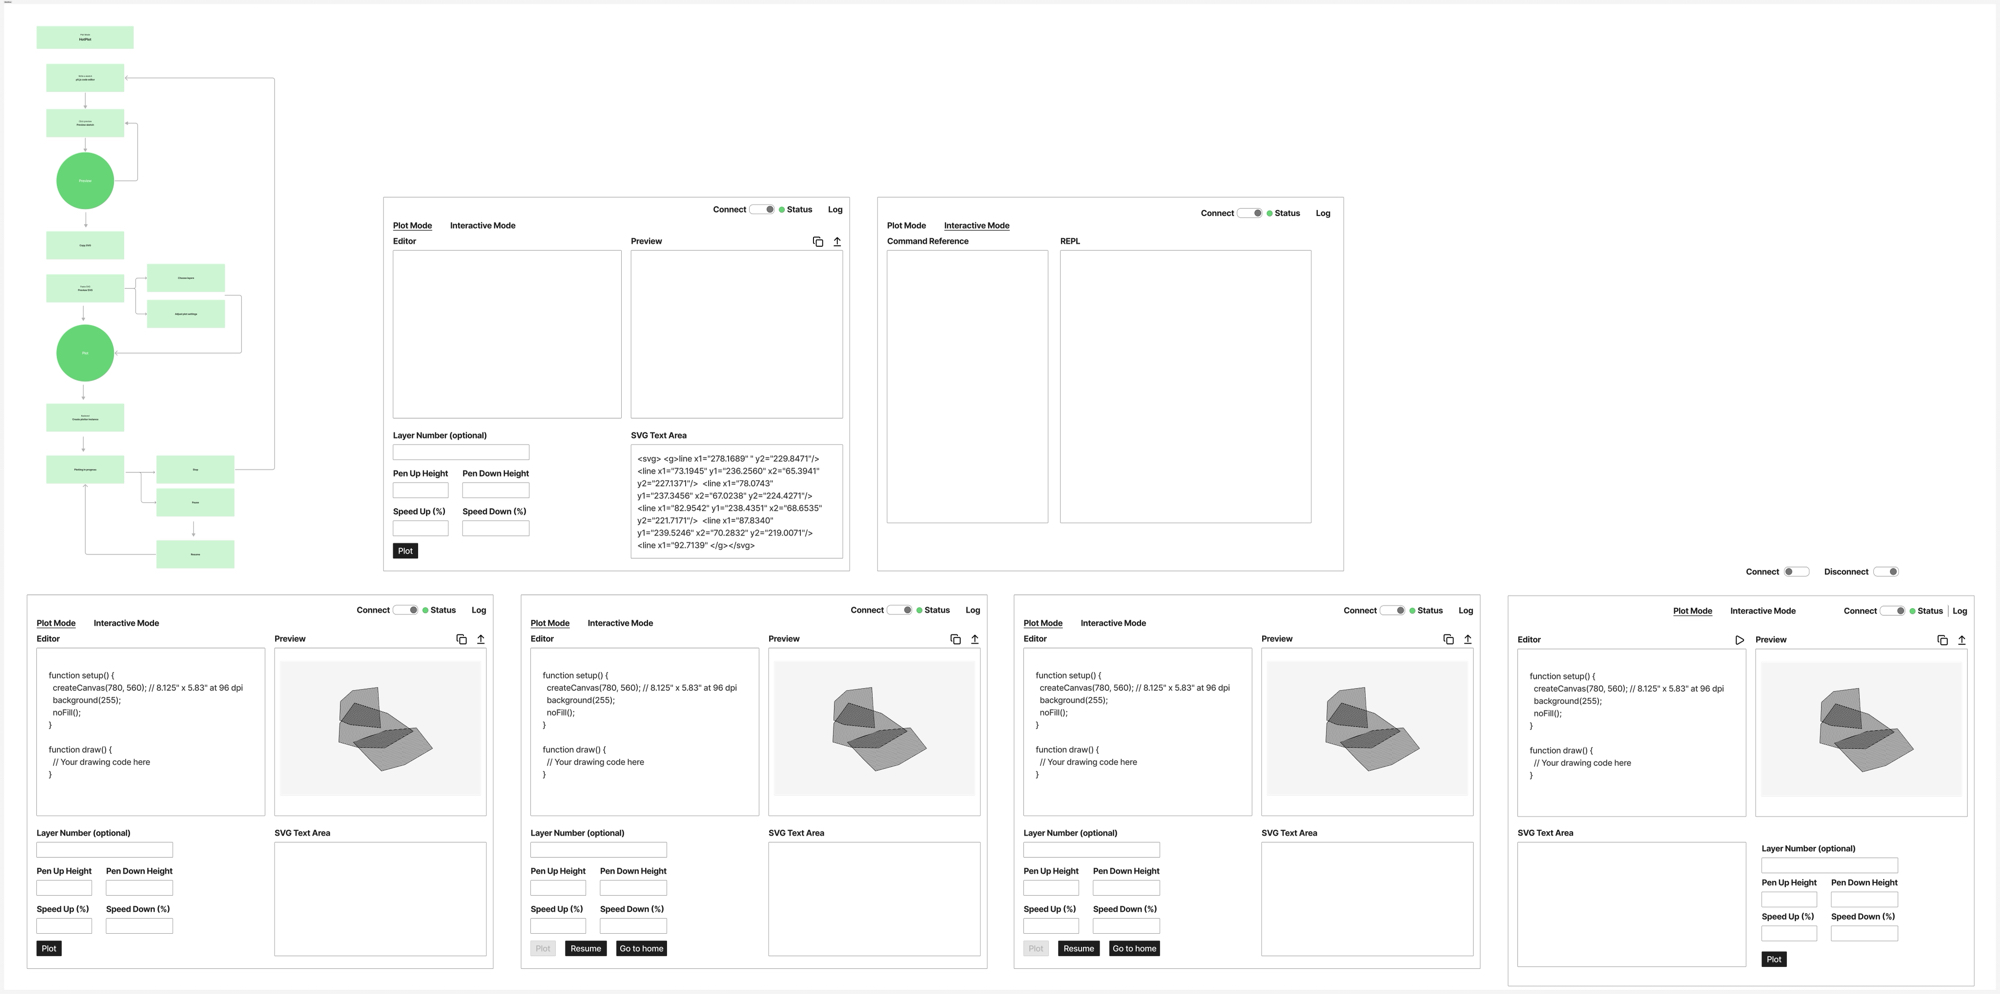
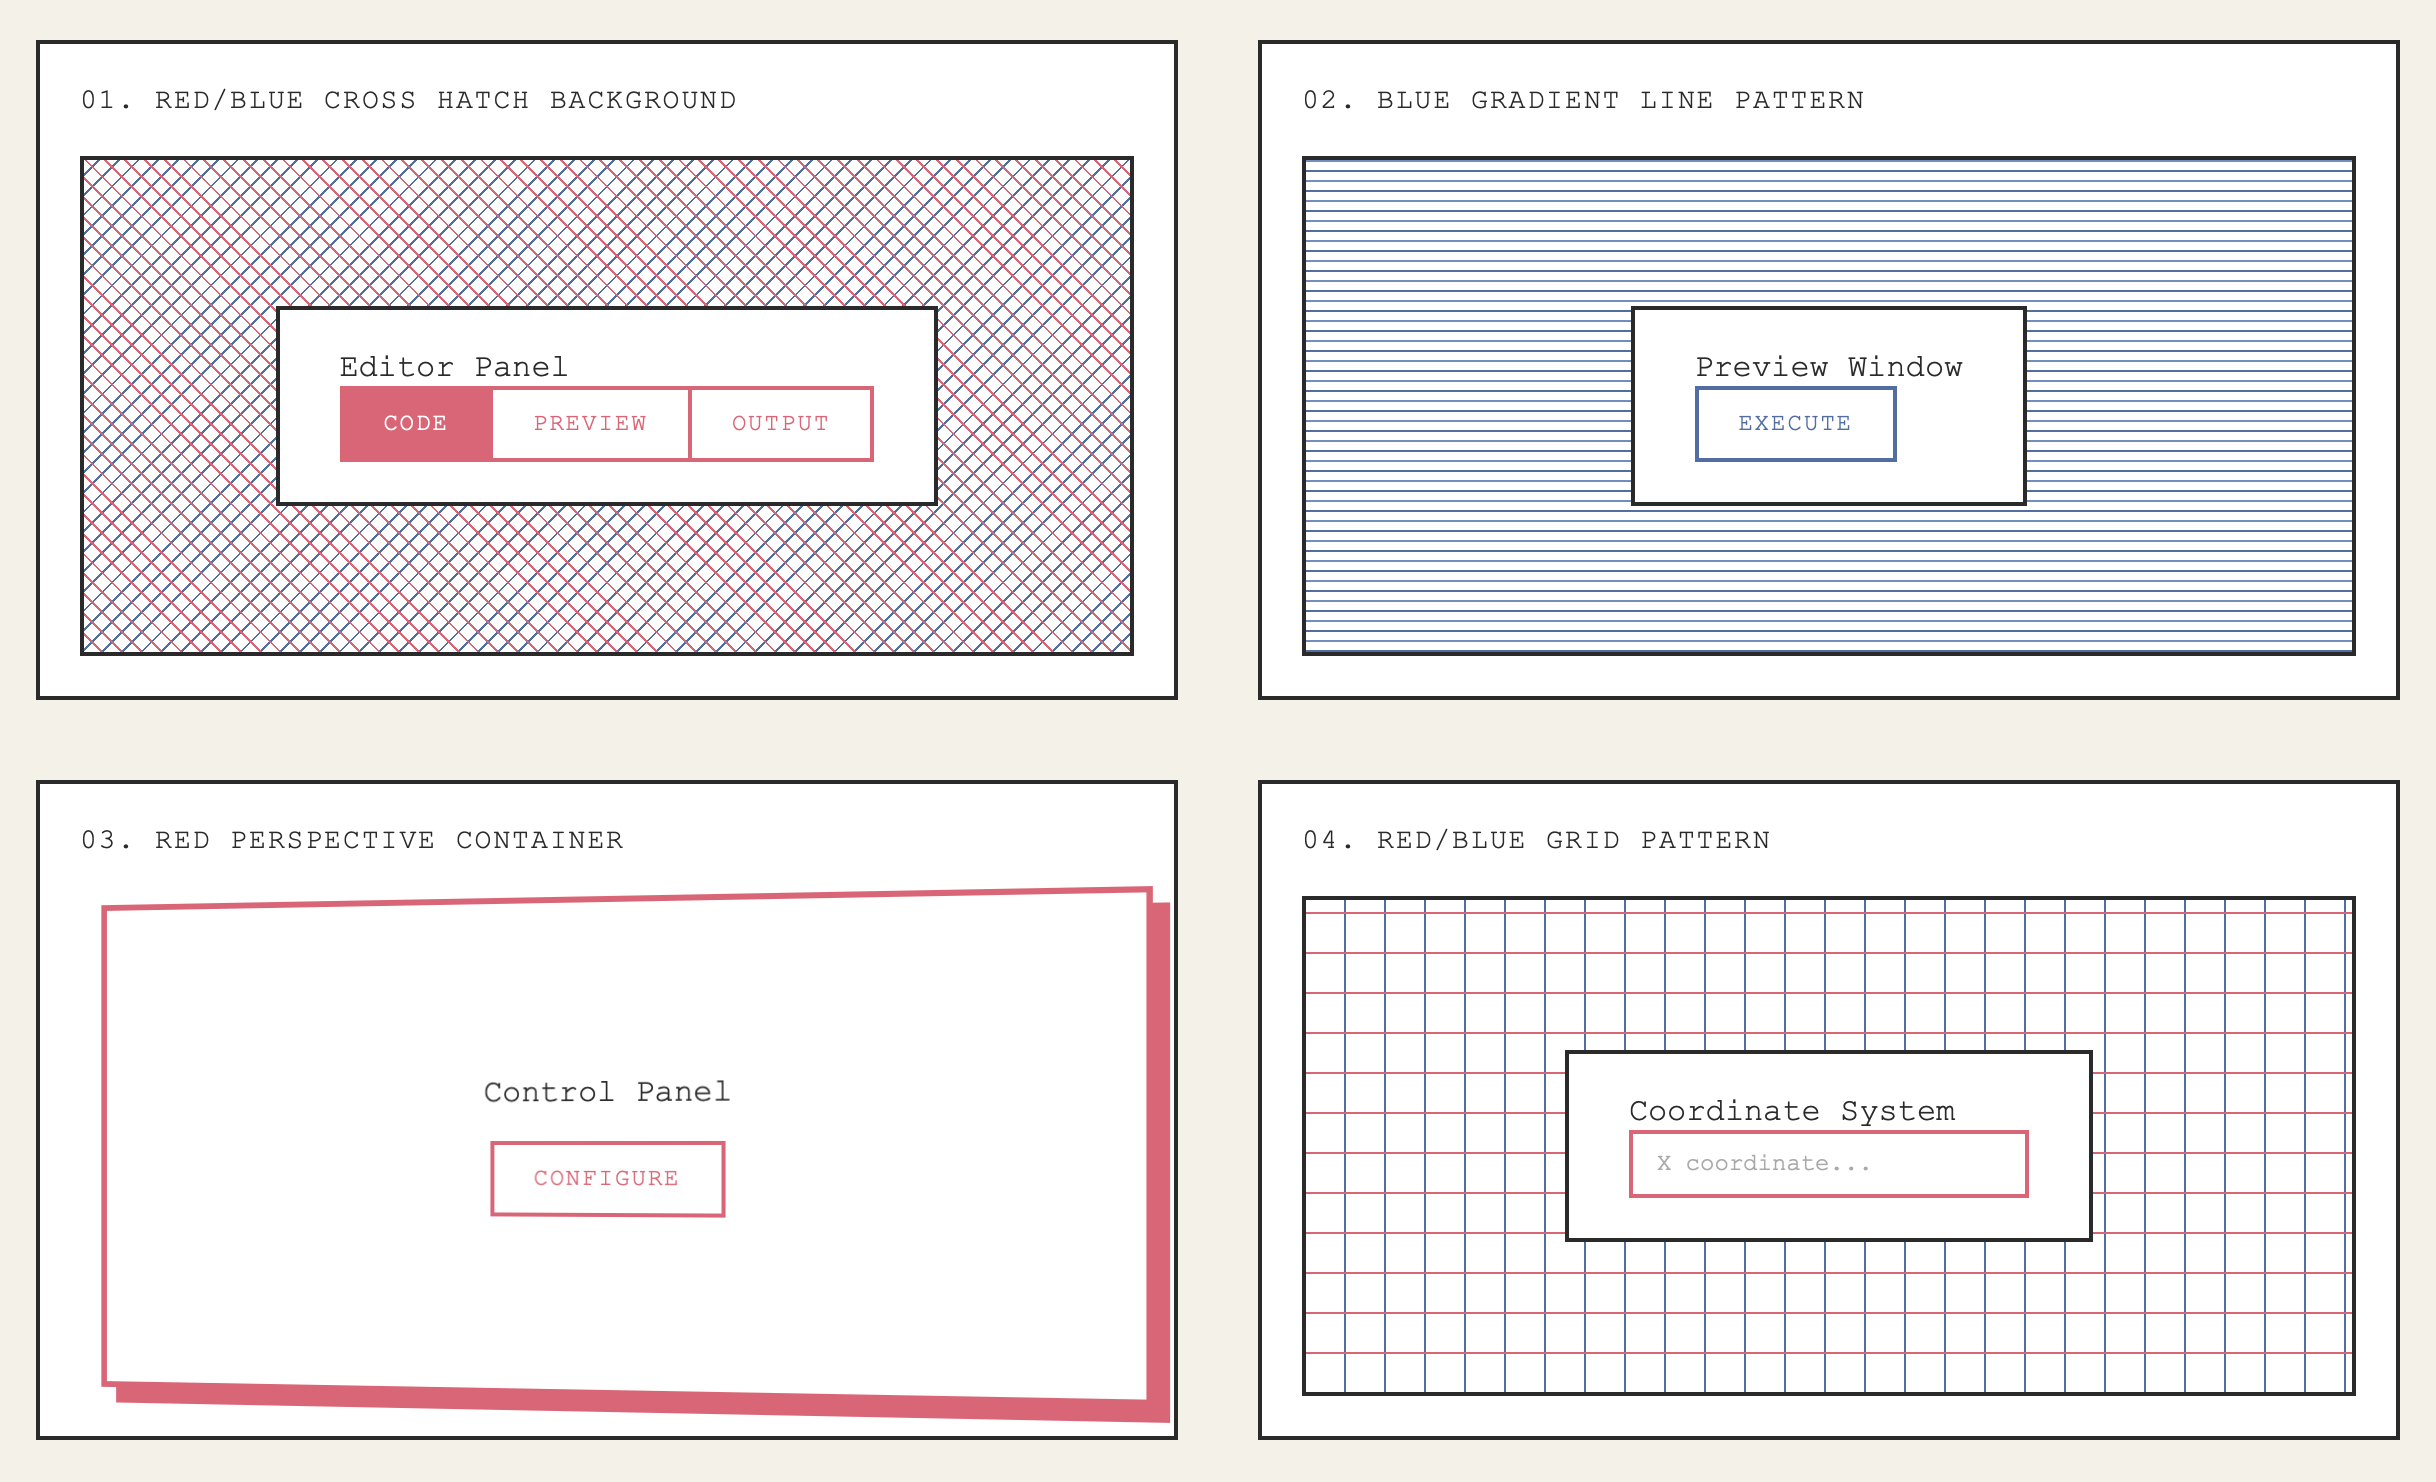
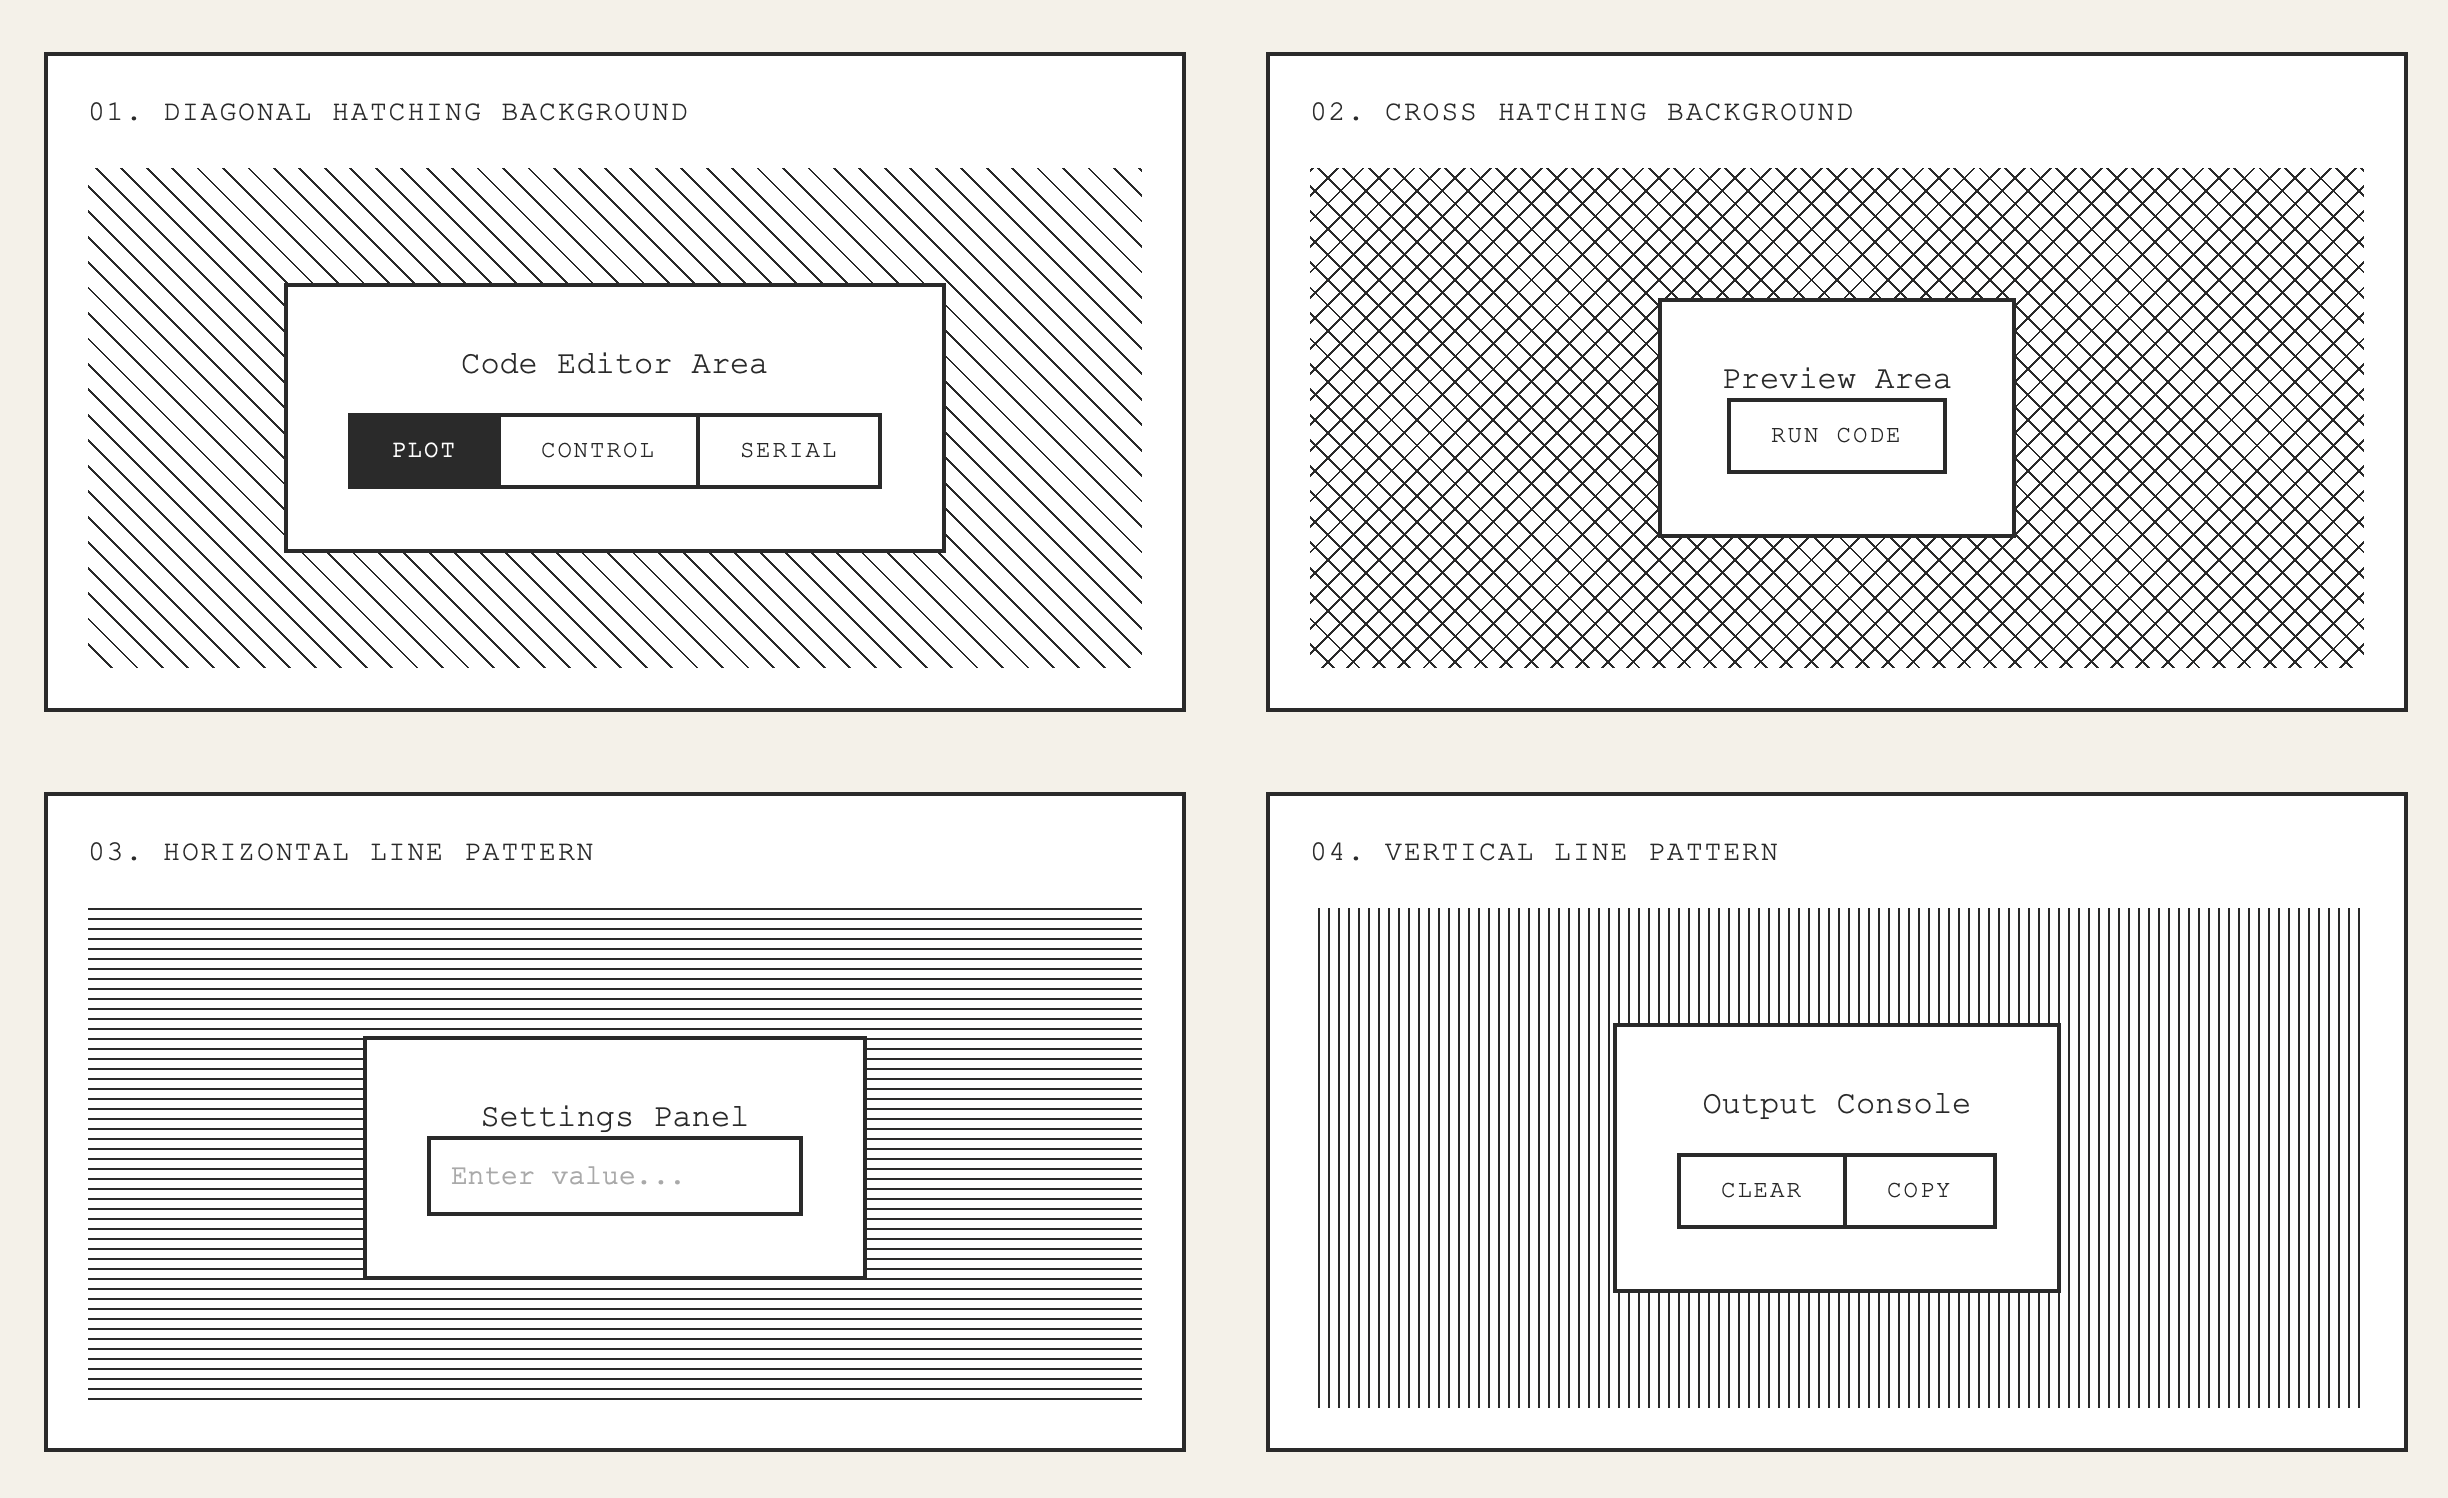
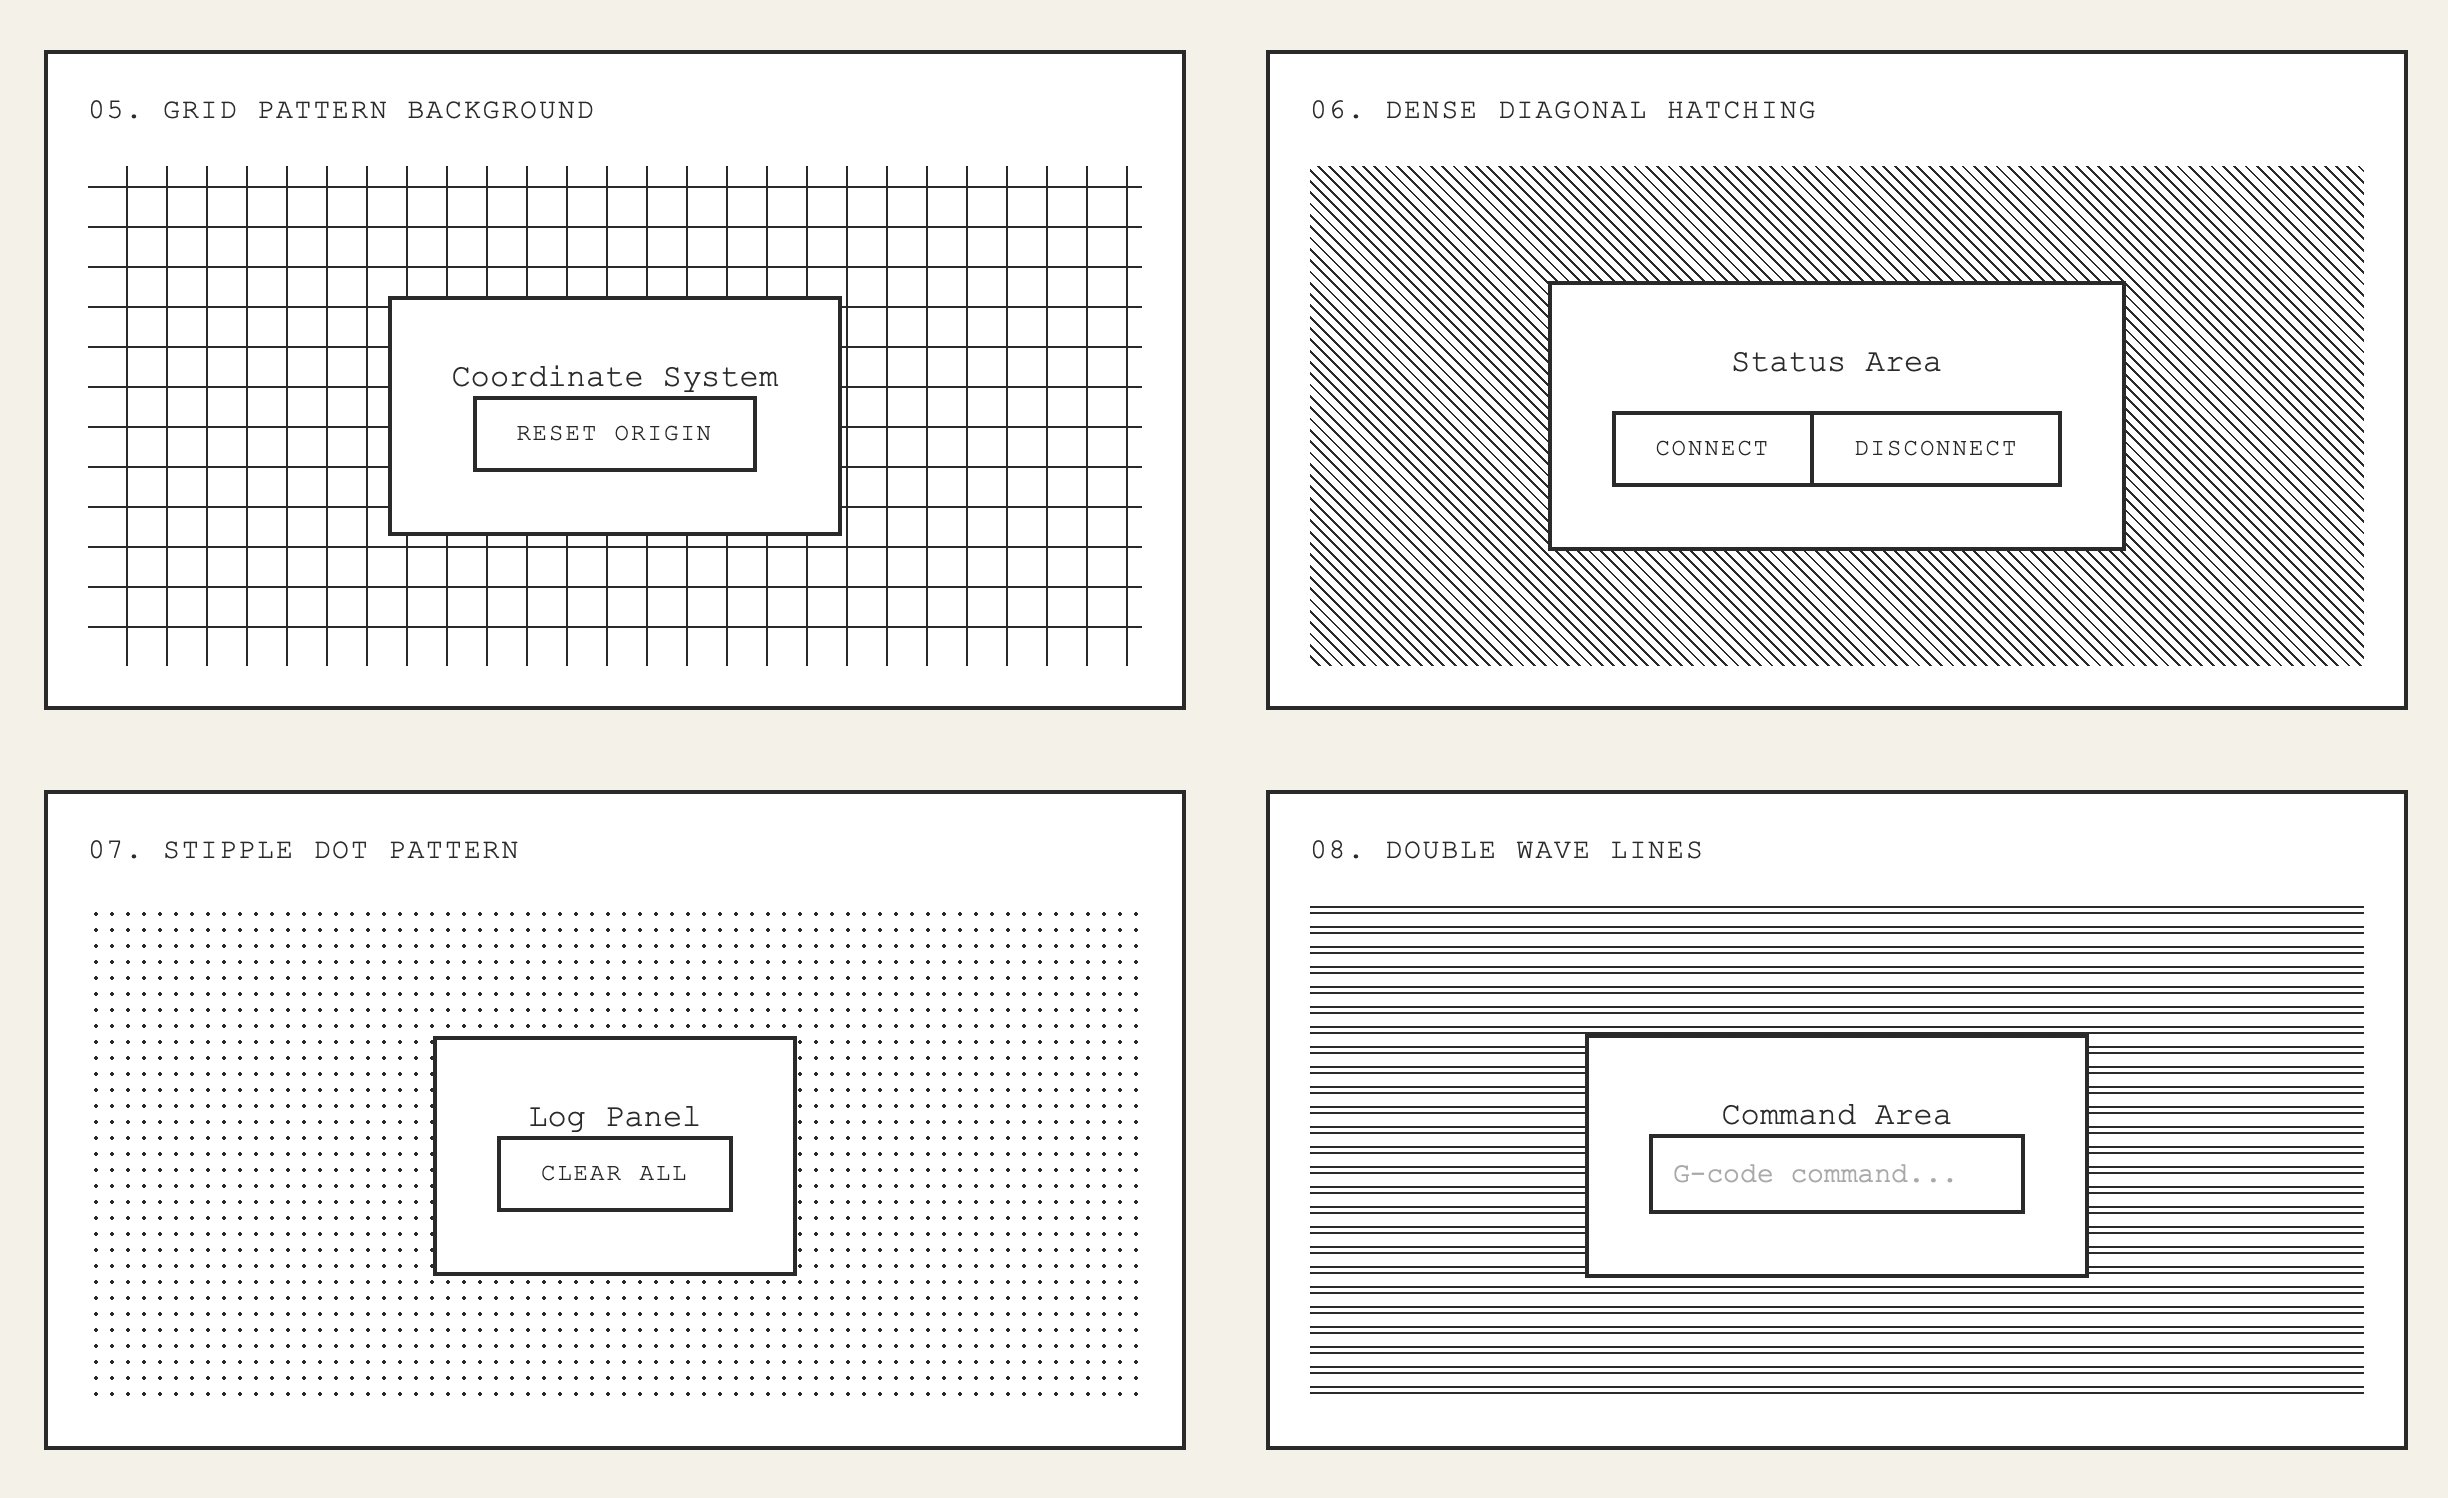
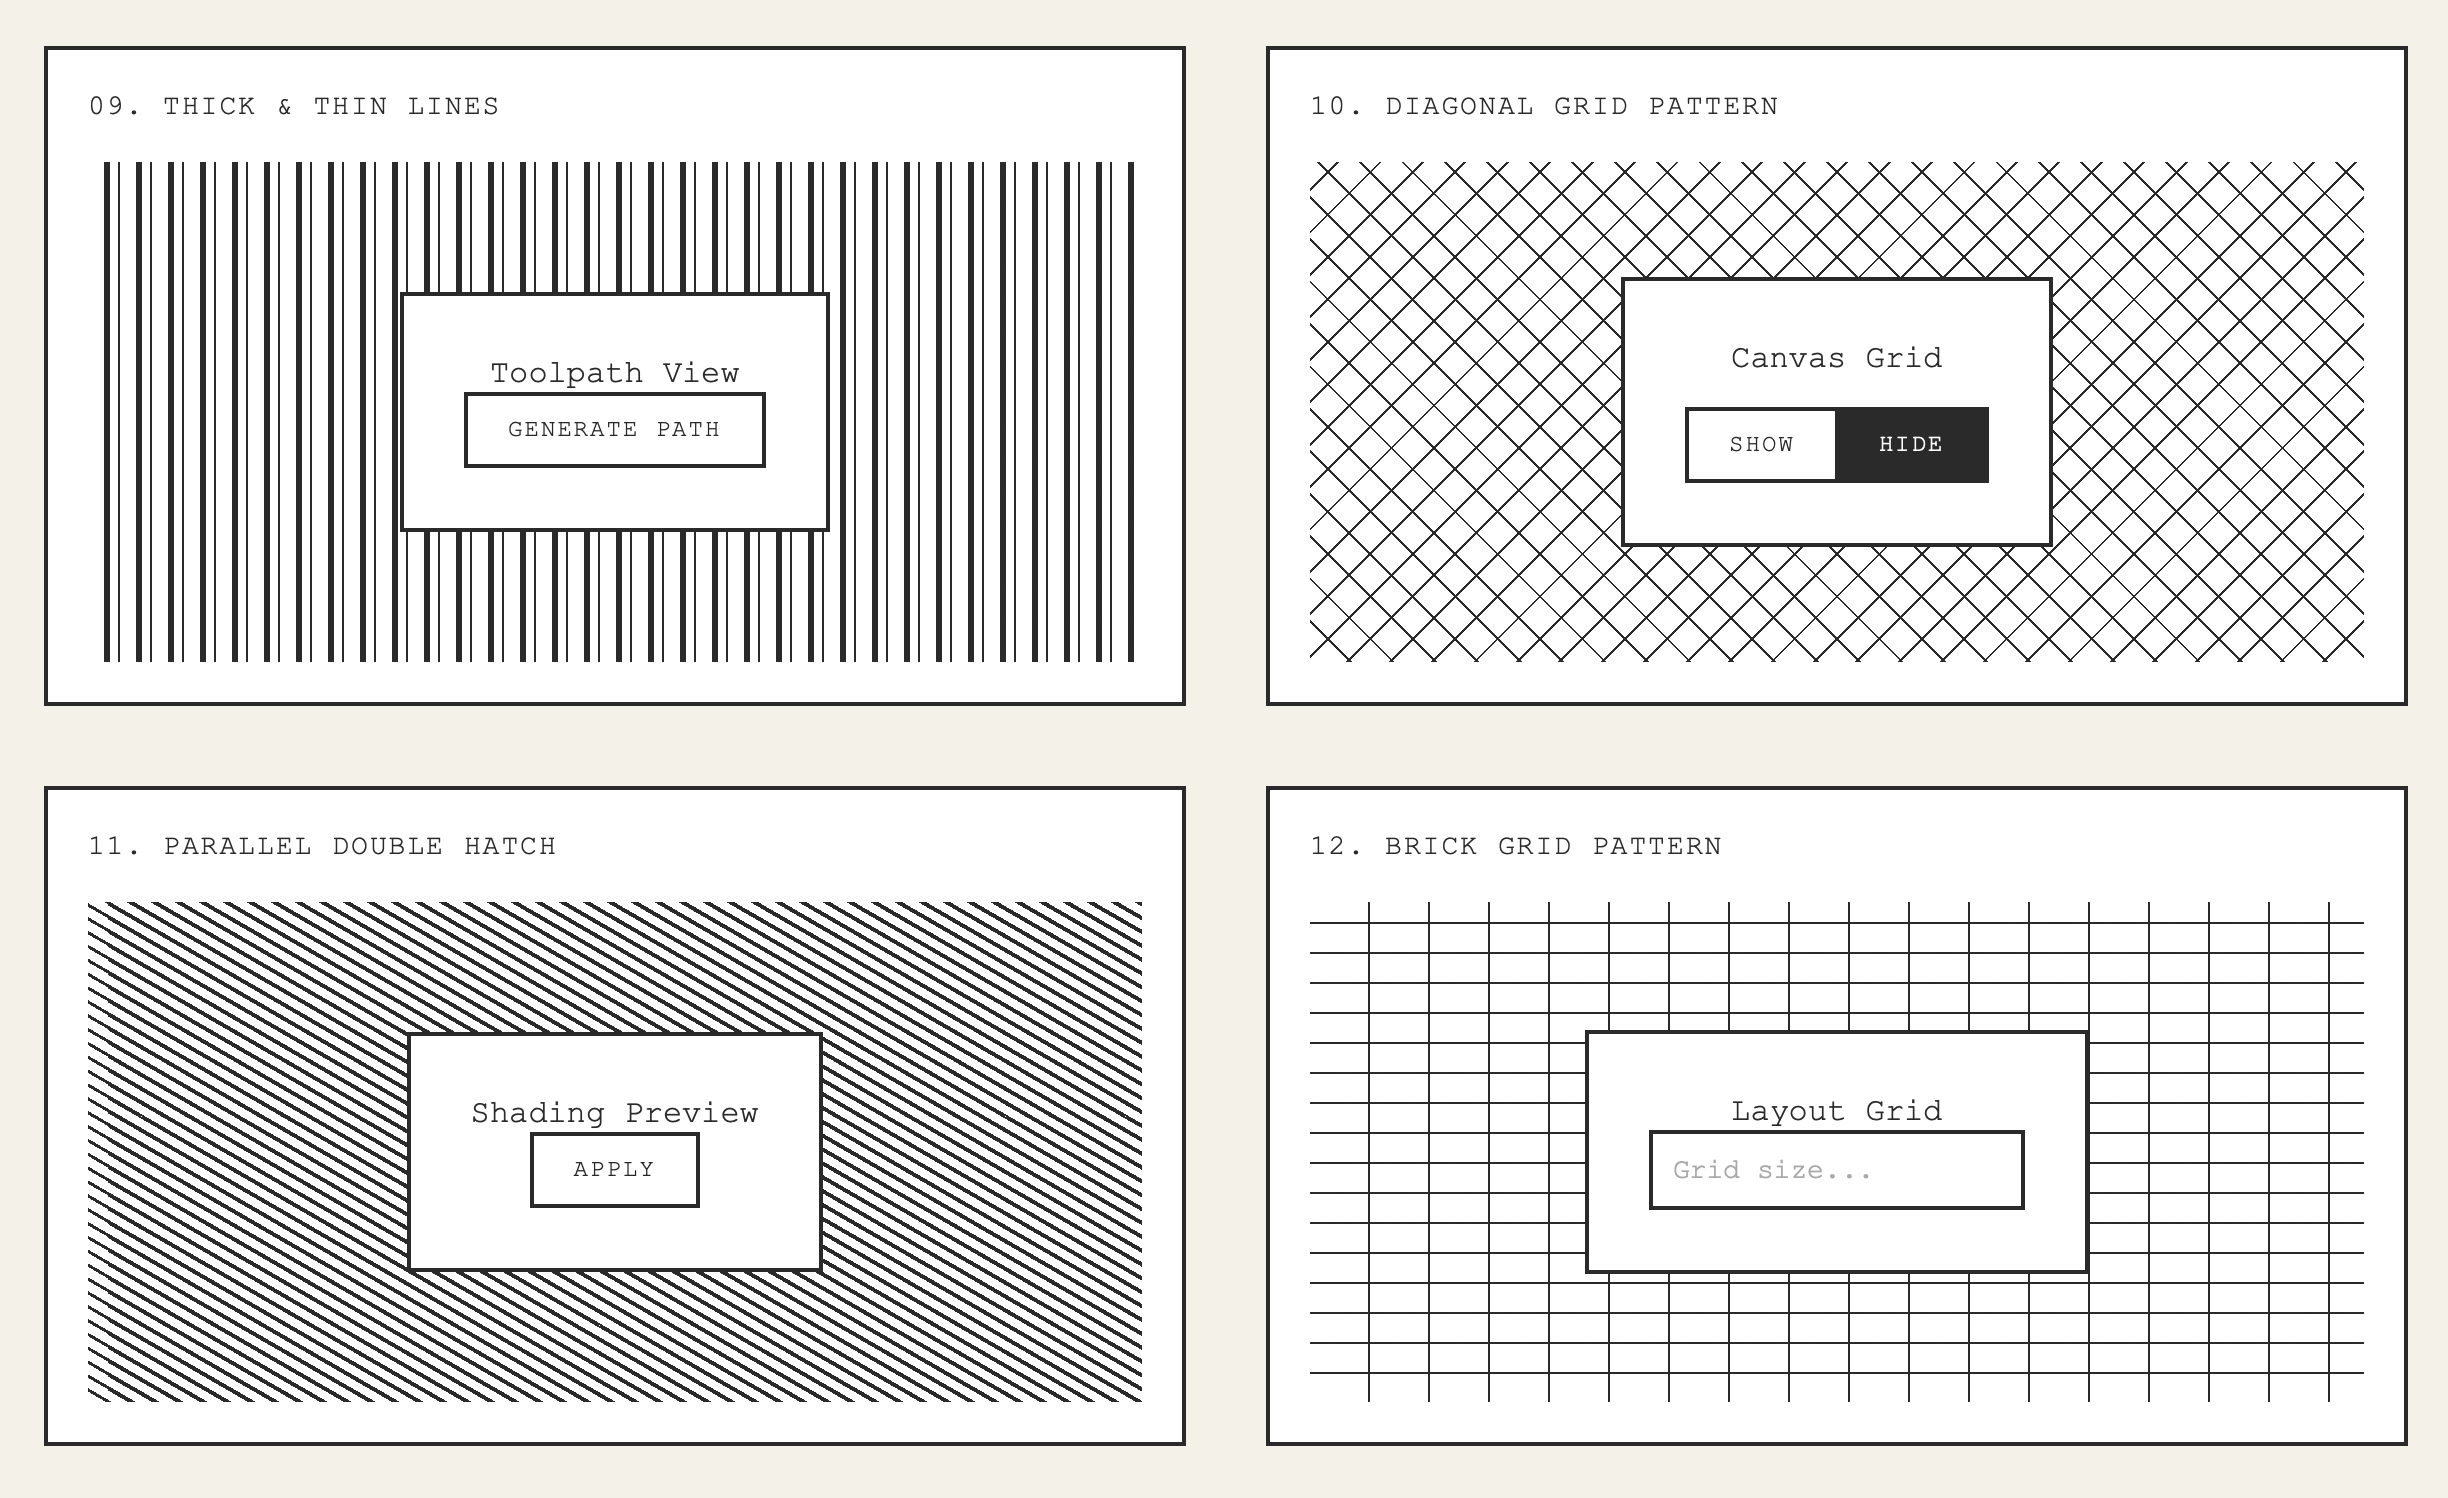
Building a UI Playground
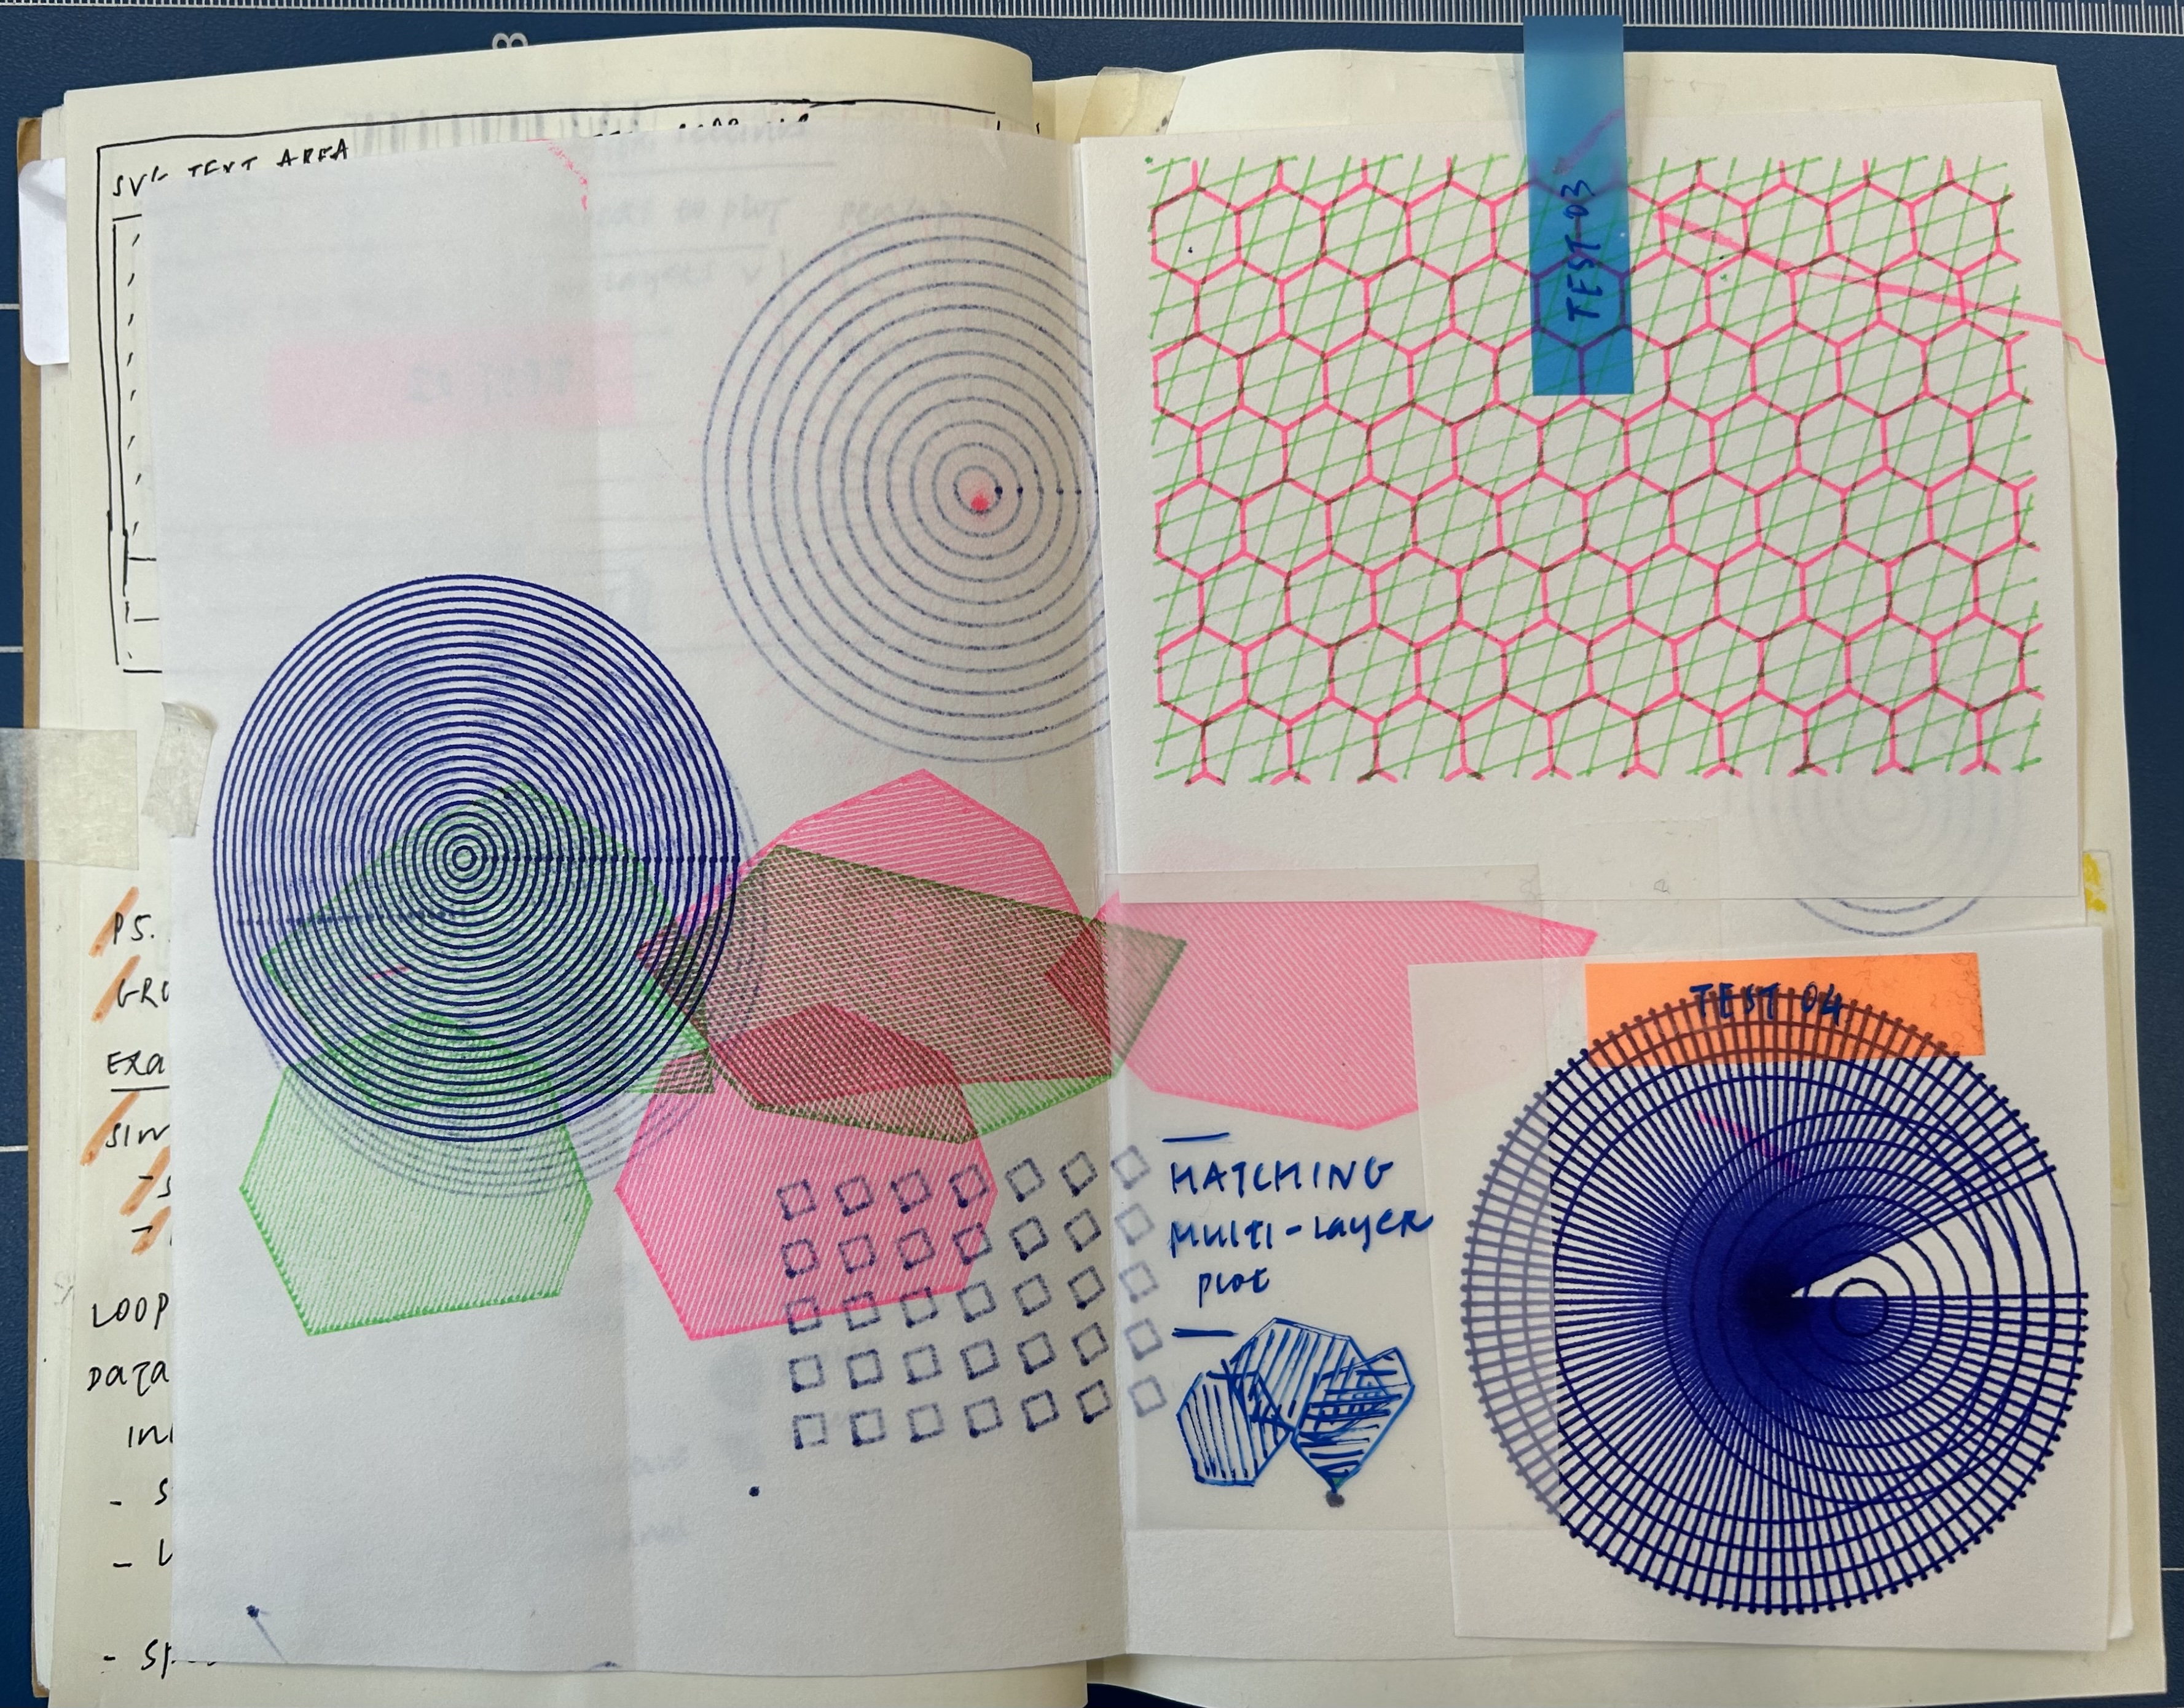
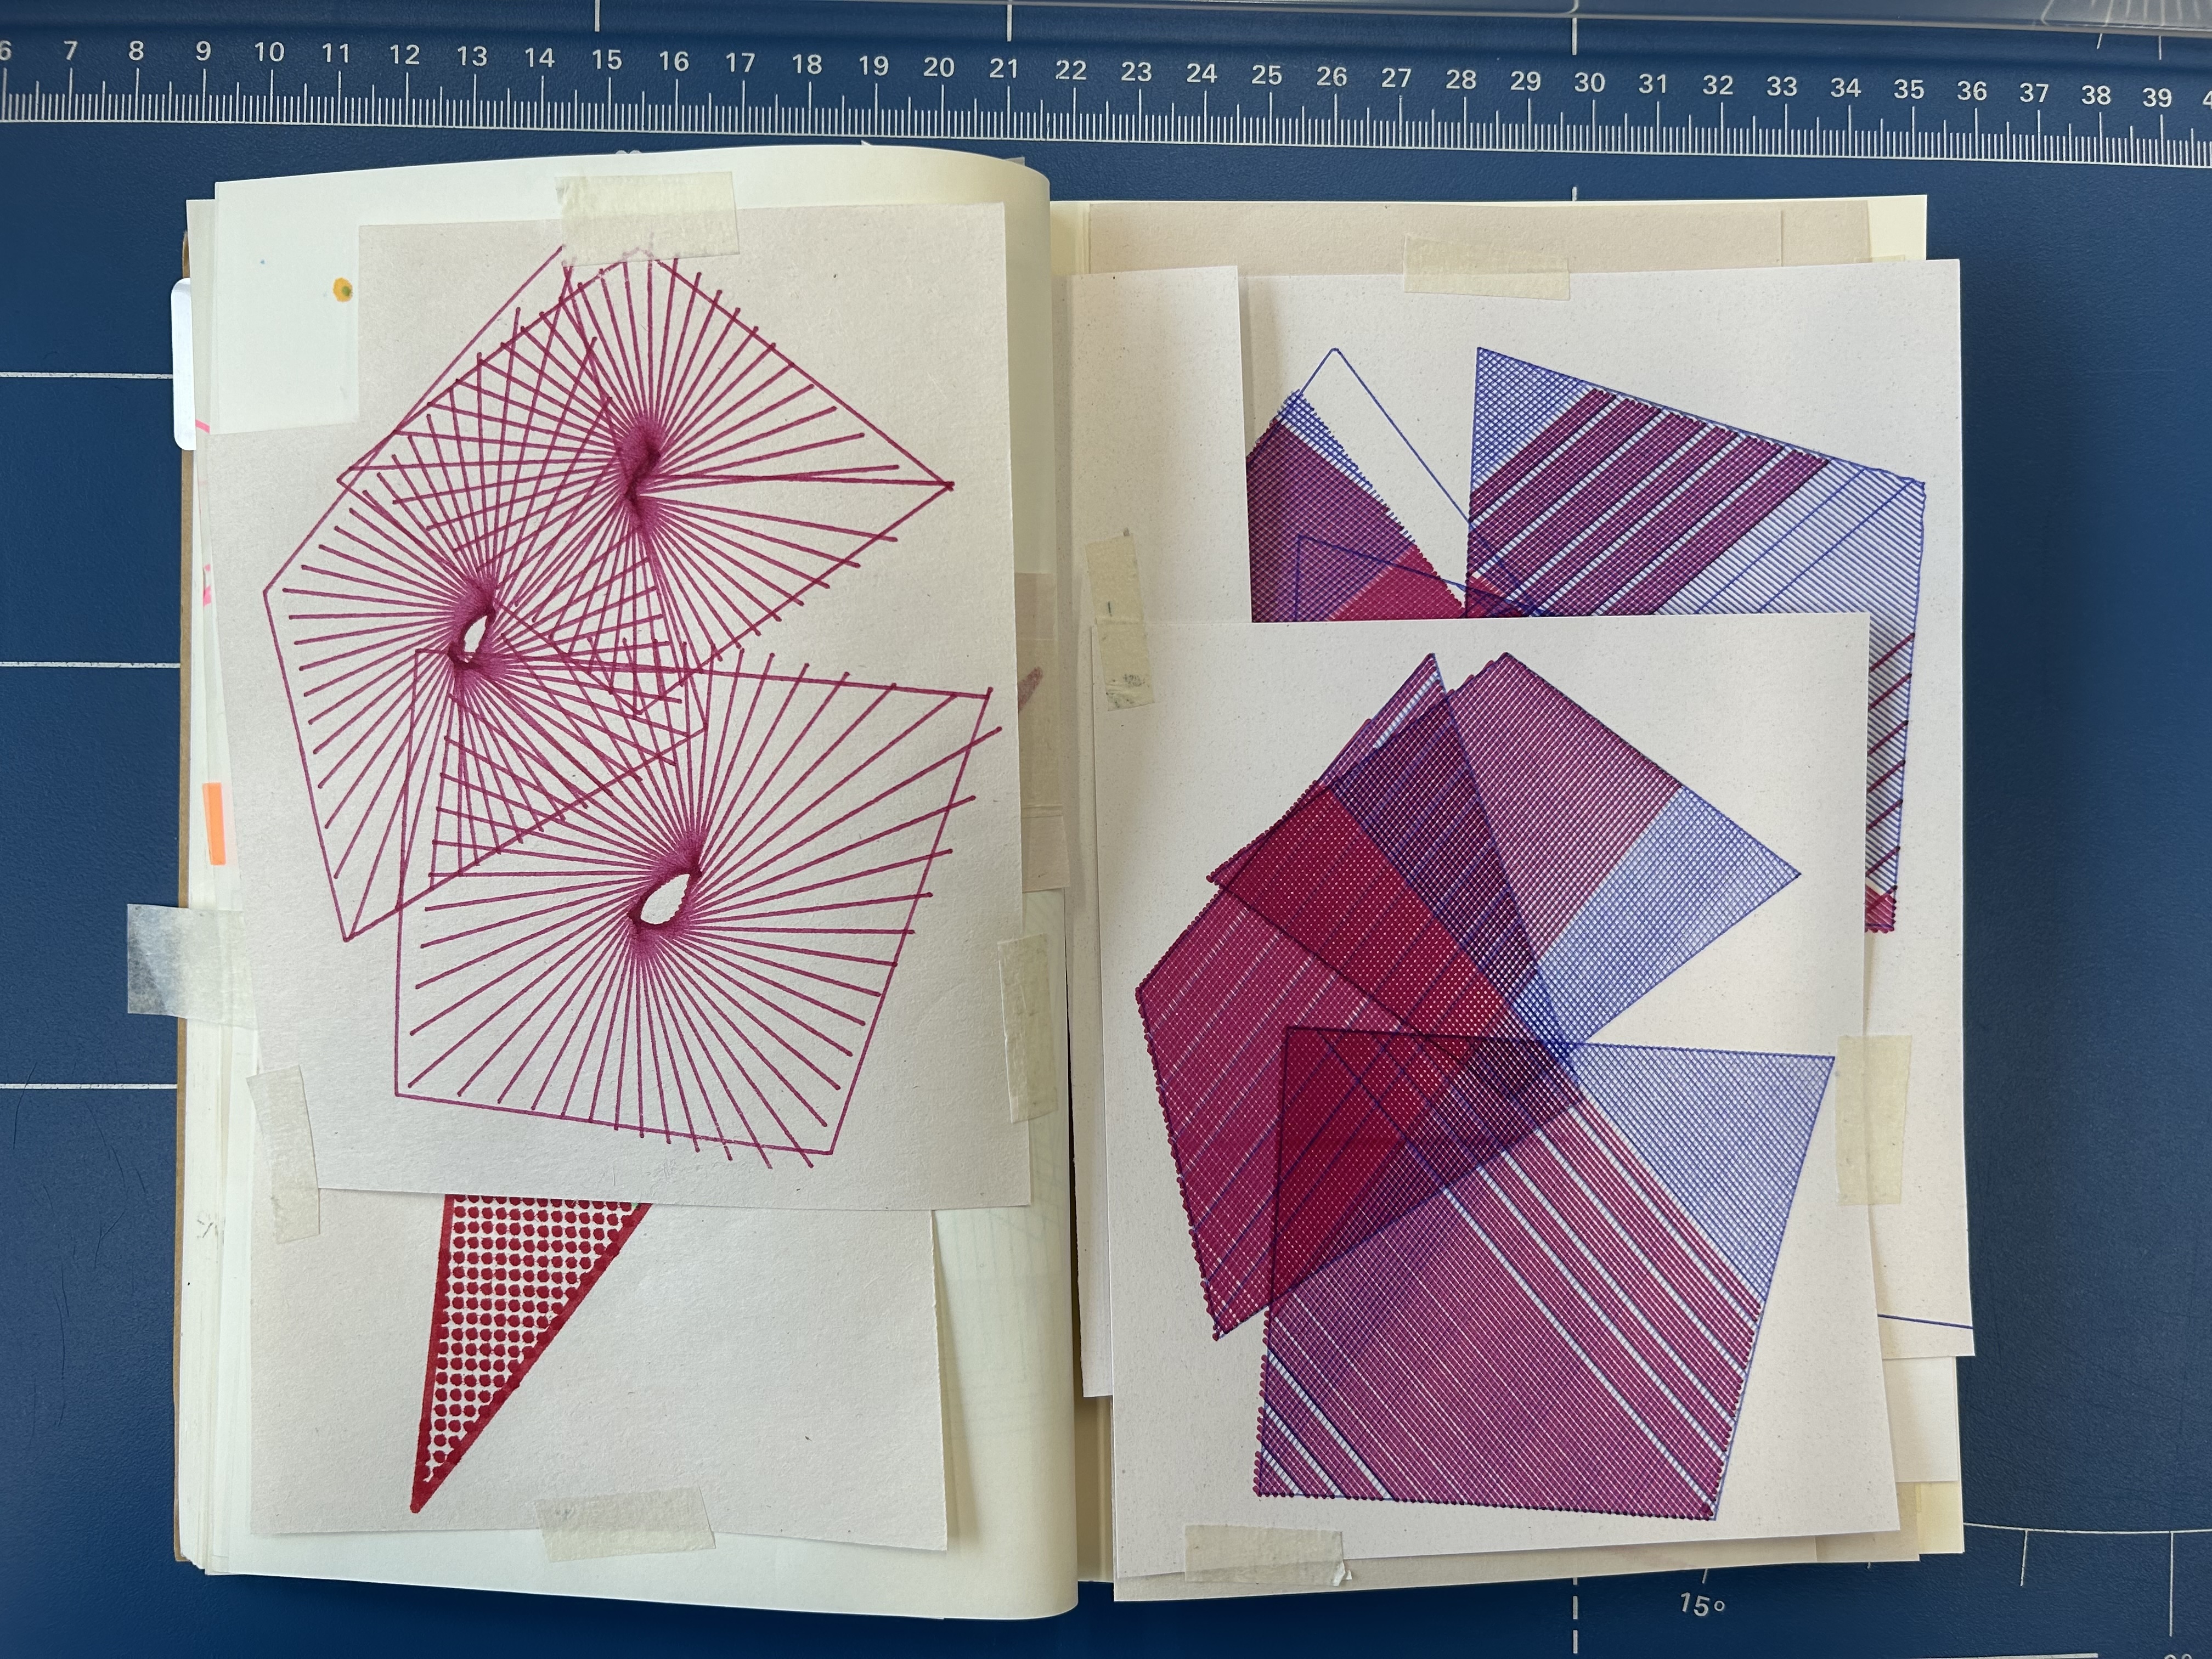
To explore what the interface should look like, I built a UI playground with a collection of standalone HTML and CSS experiments where I could try different visual ideas. Each page is essentially a small visual study of textures, borders, layout, depth and micro interactions. Because it lives outside of the main application, I could try ideas freely and compare variations side by side.

A lot of the visual direction came from earlier pen plotter drawings and from the typewriter works of Dom Sylvester Houédard. Houédard’s ‘typestracts’ are built entirely from typewriter characters — slashes, dots, brackets, repeated patterns — arranged into intricate visual structures. These compositions bring out beautiful mechanical and geometric qualities and are a natural fit given how pen plotters produce similar aesthetics.
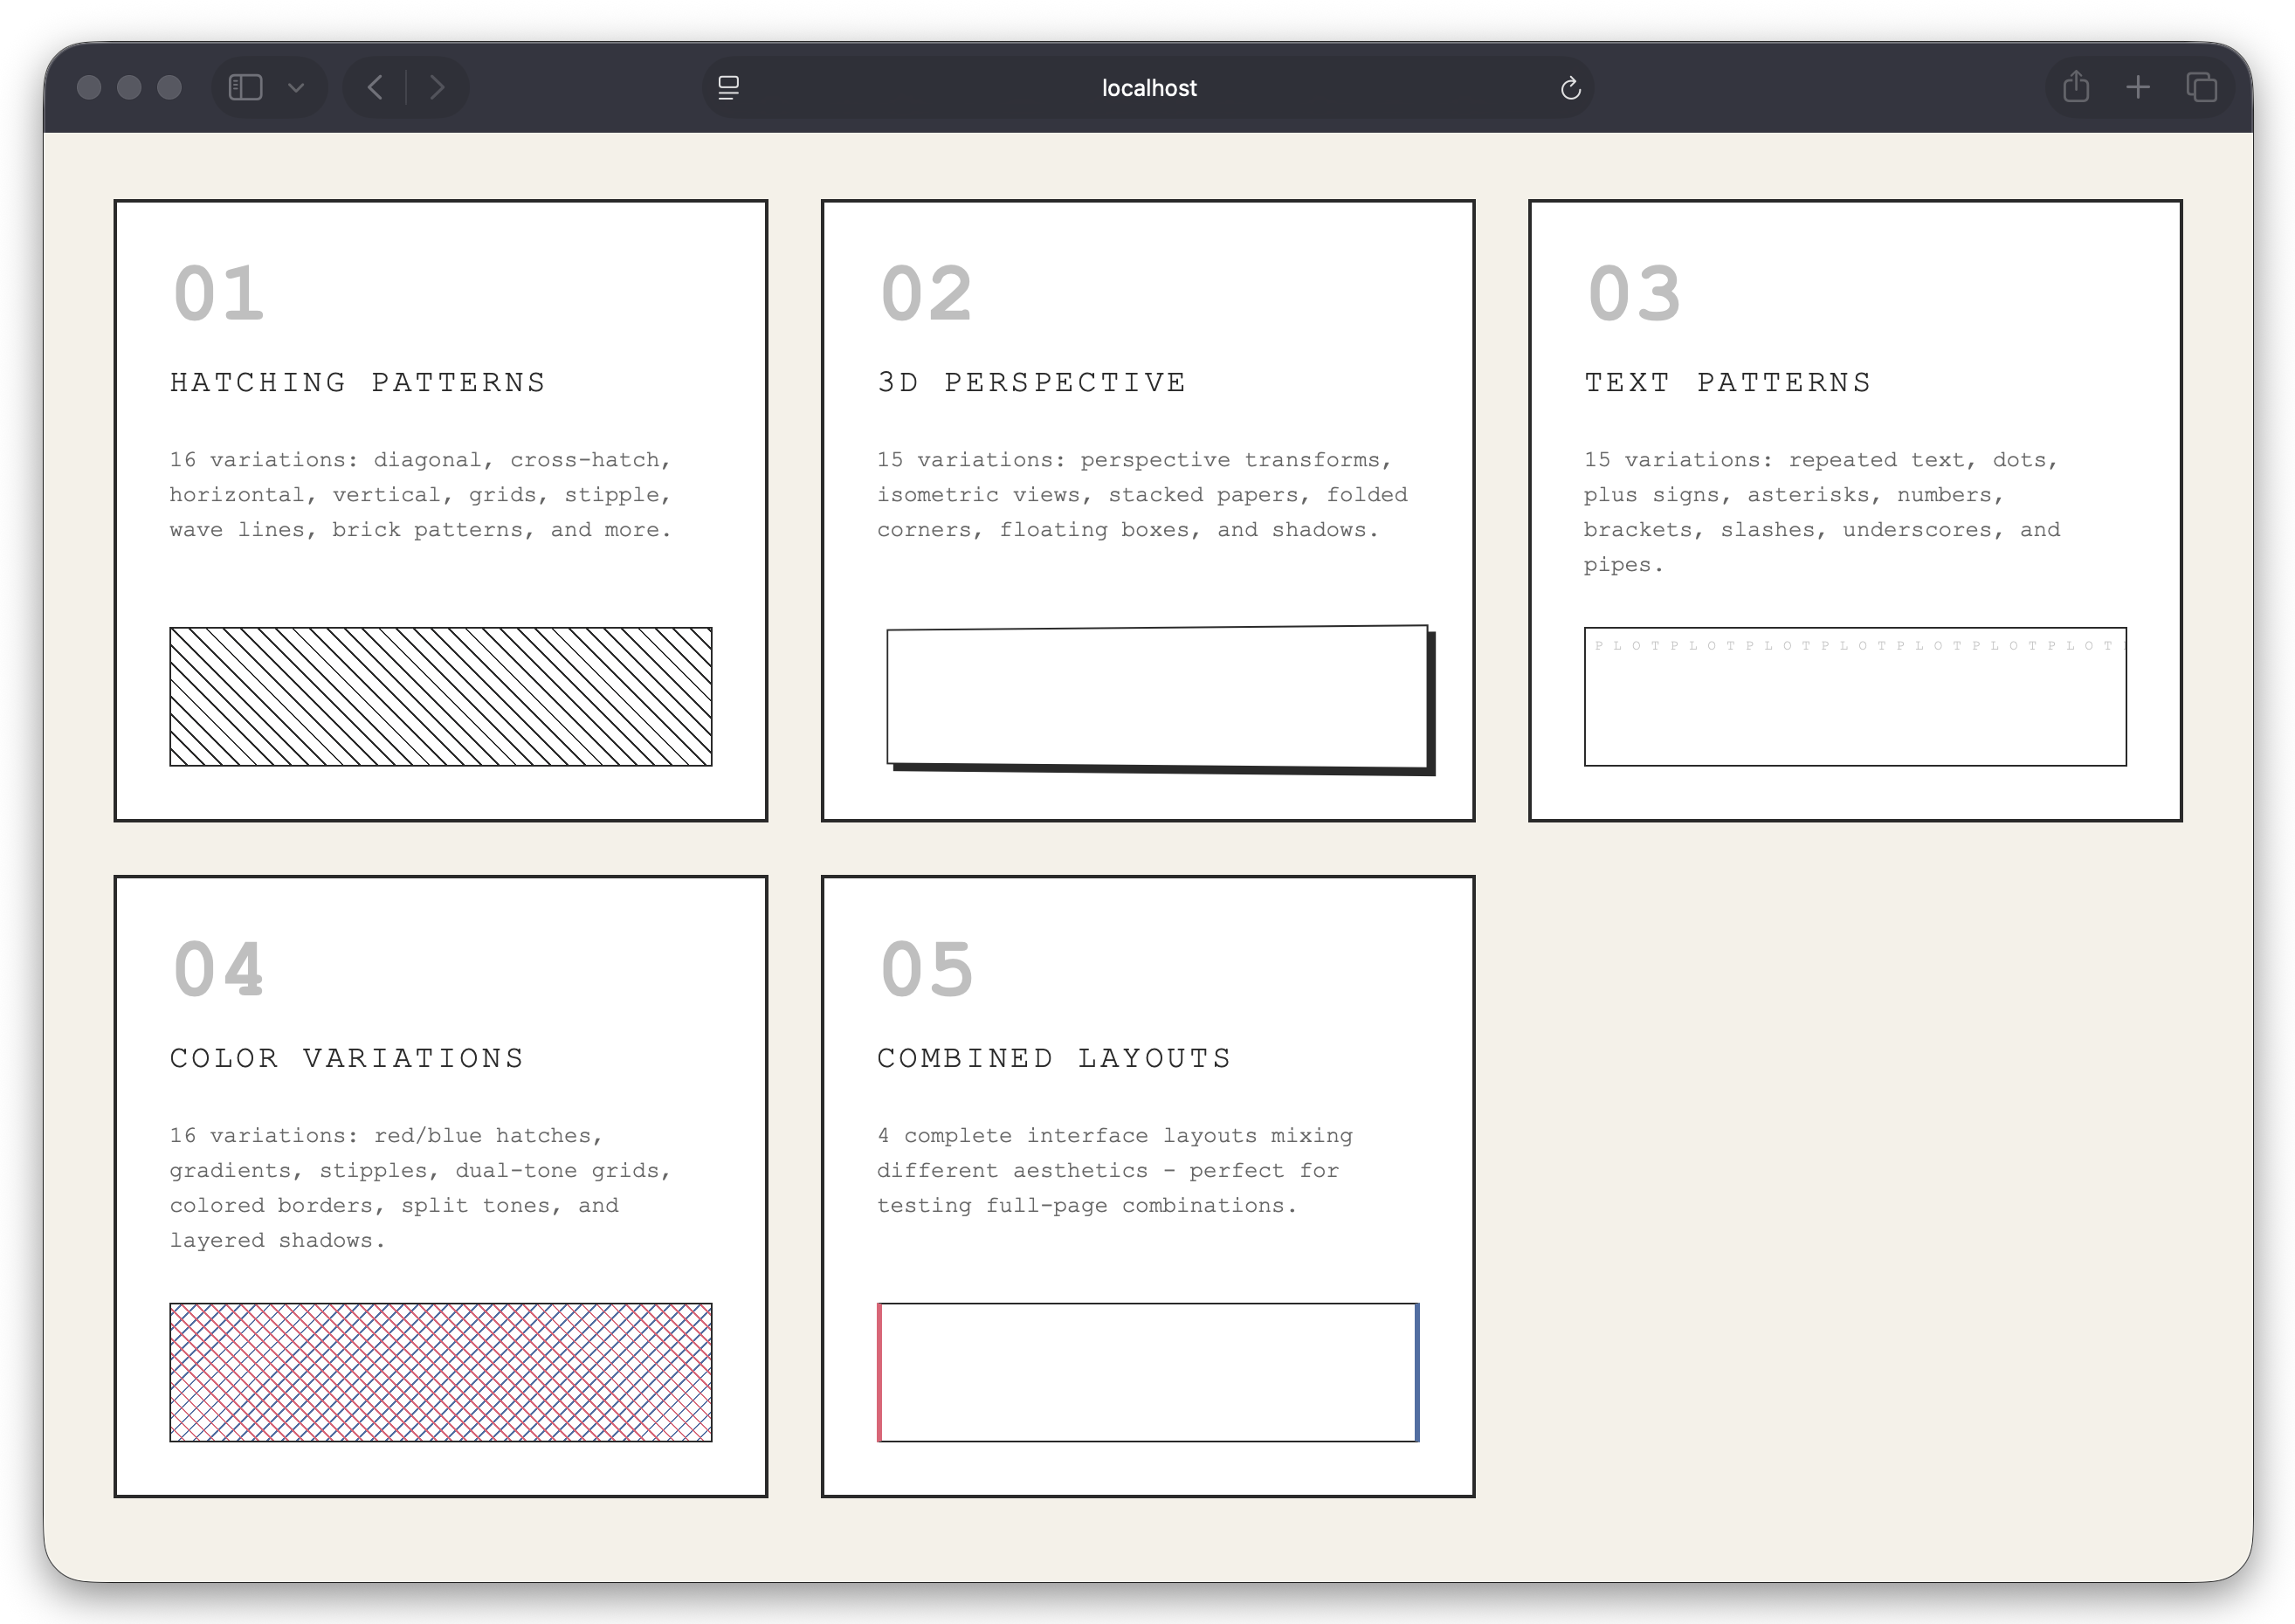
I wanted the interface to have a similar visual treatment. Elements like the background behind the SVG area, the stippled preview texture, and some of the hatching patterns were all derived from this. I also built a few variations for specific interface components like the code editor, button, preview panel and the layout itself. As the playground grew, I started giving the variations short identifiers so I could refer to them later while composing the UI.
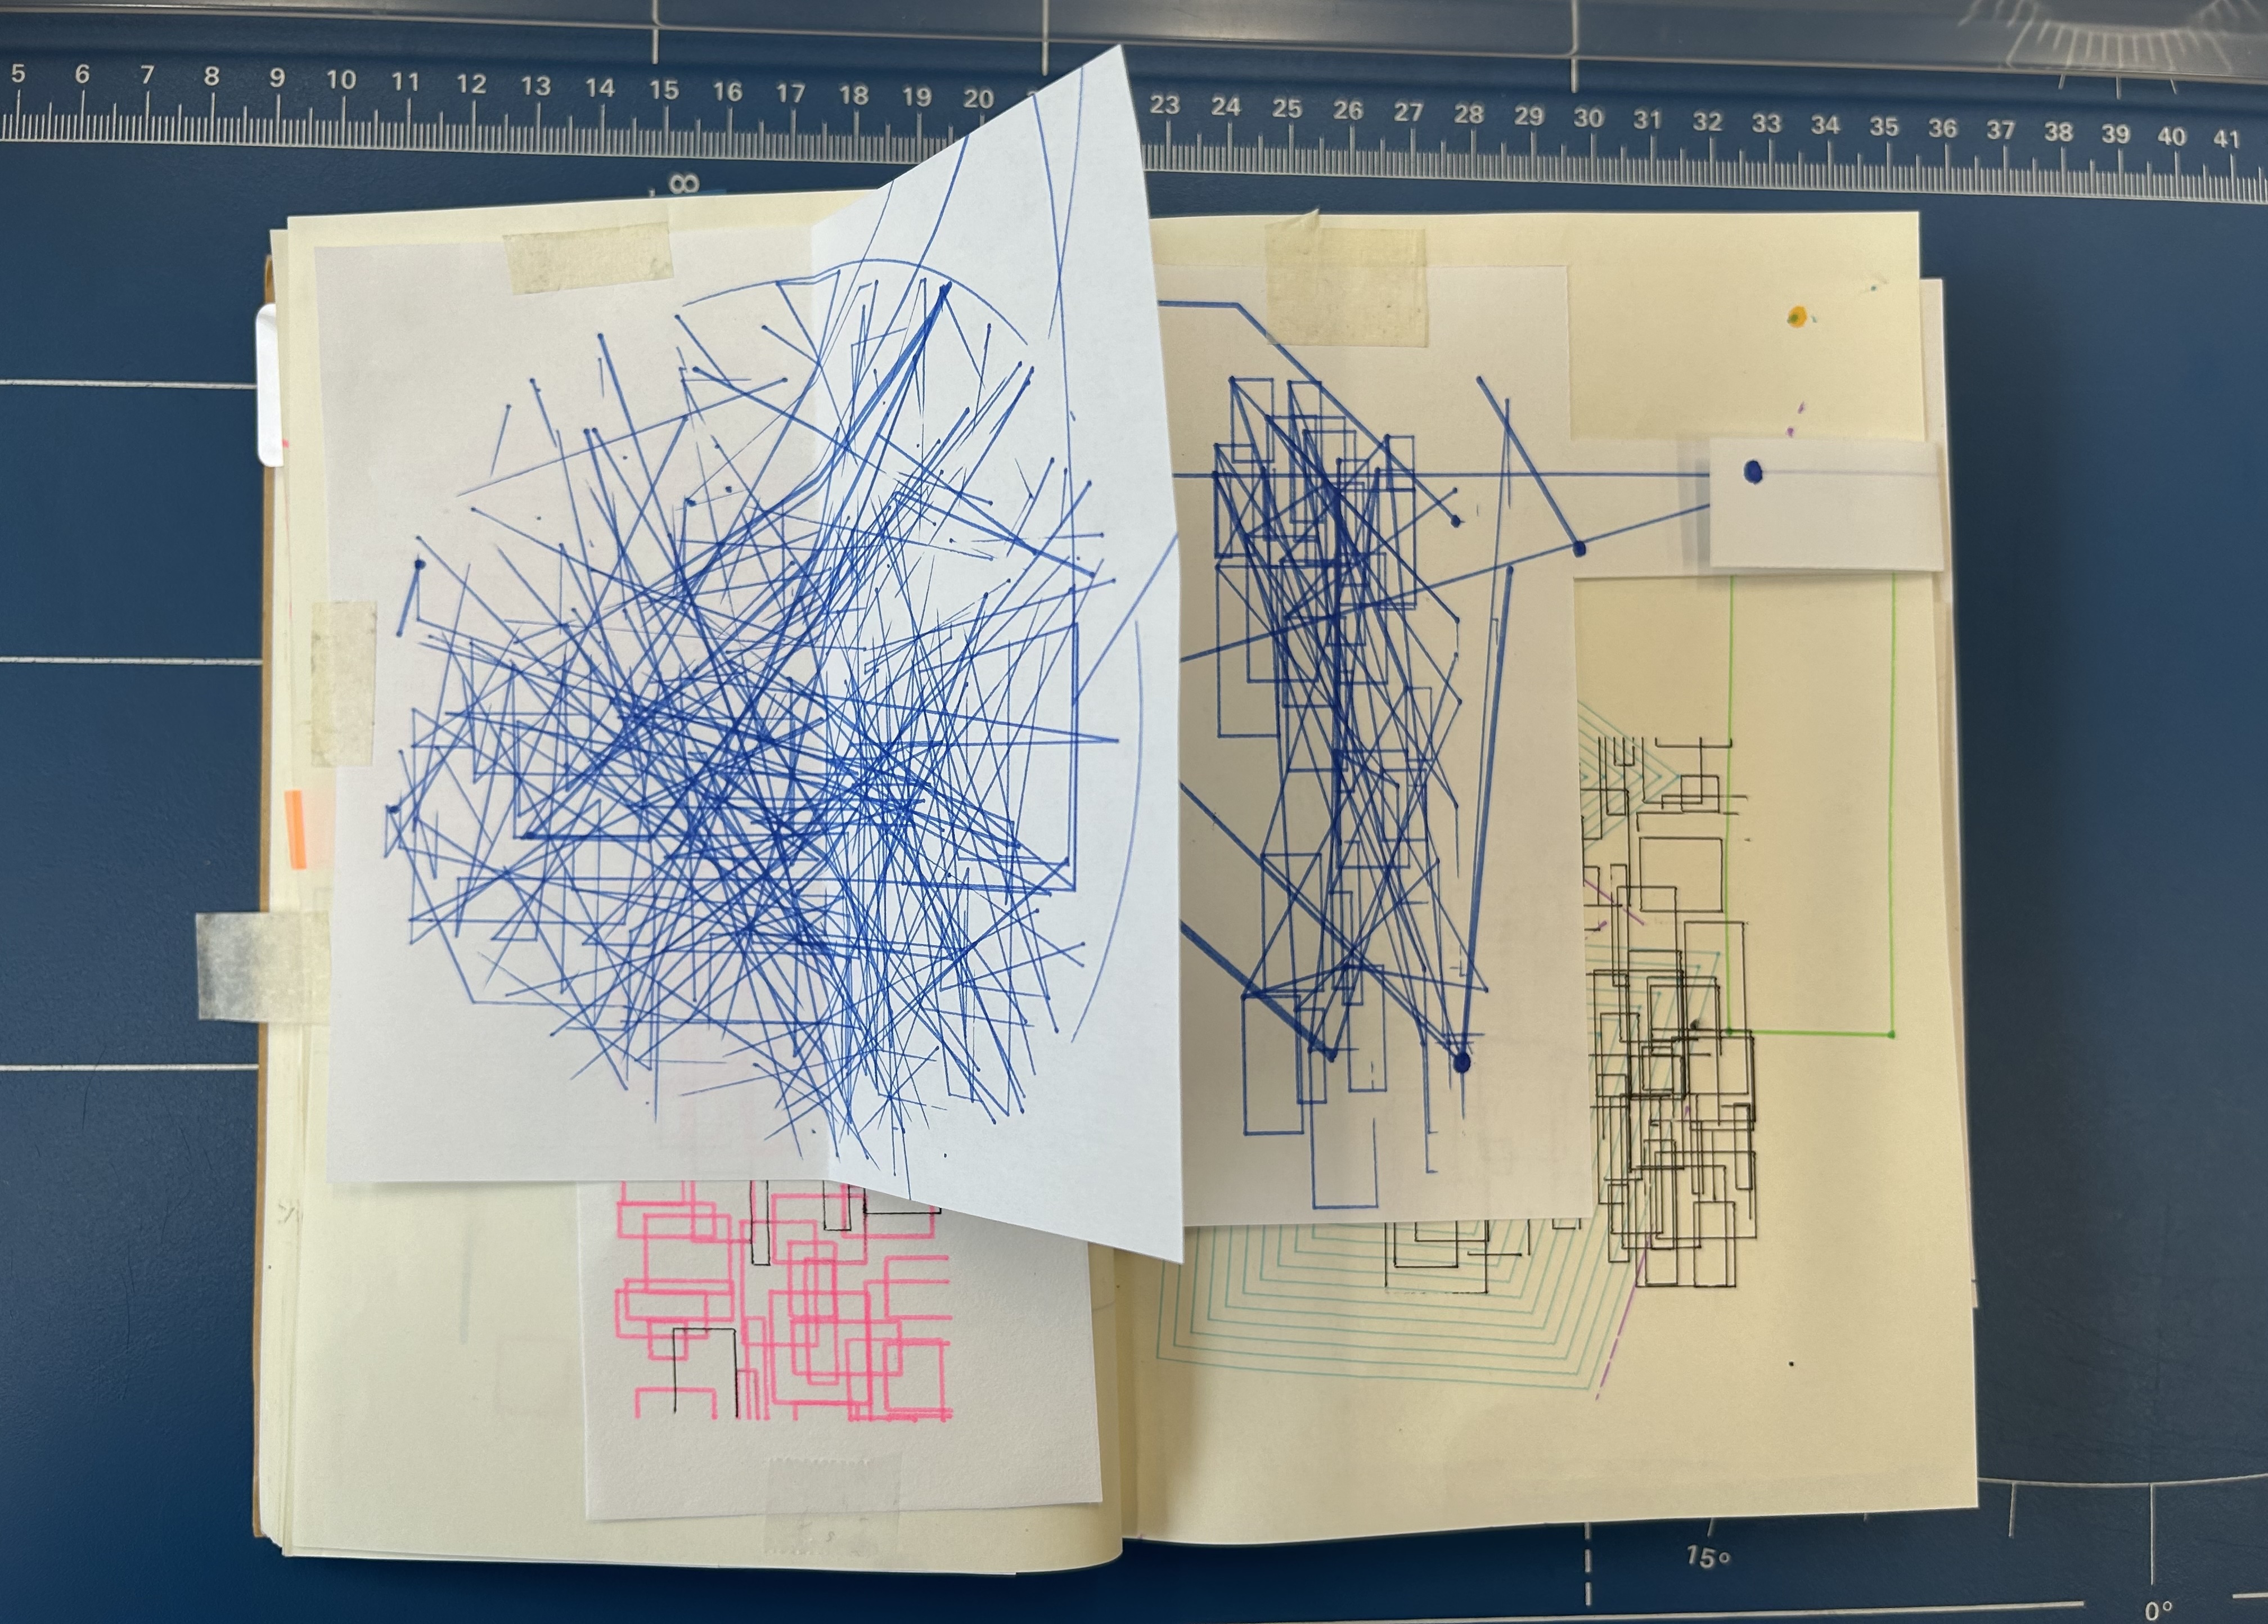
Iterations and Testing the Plotter in Action
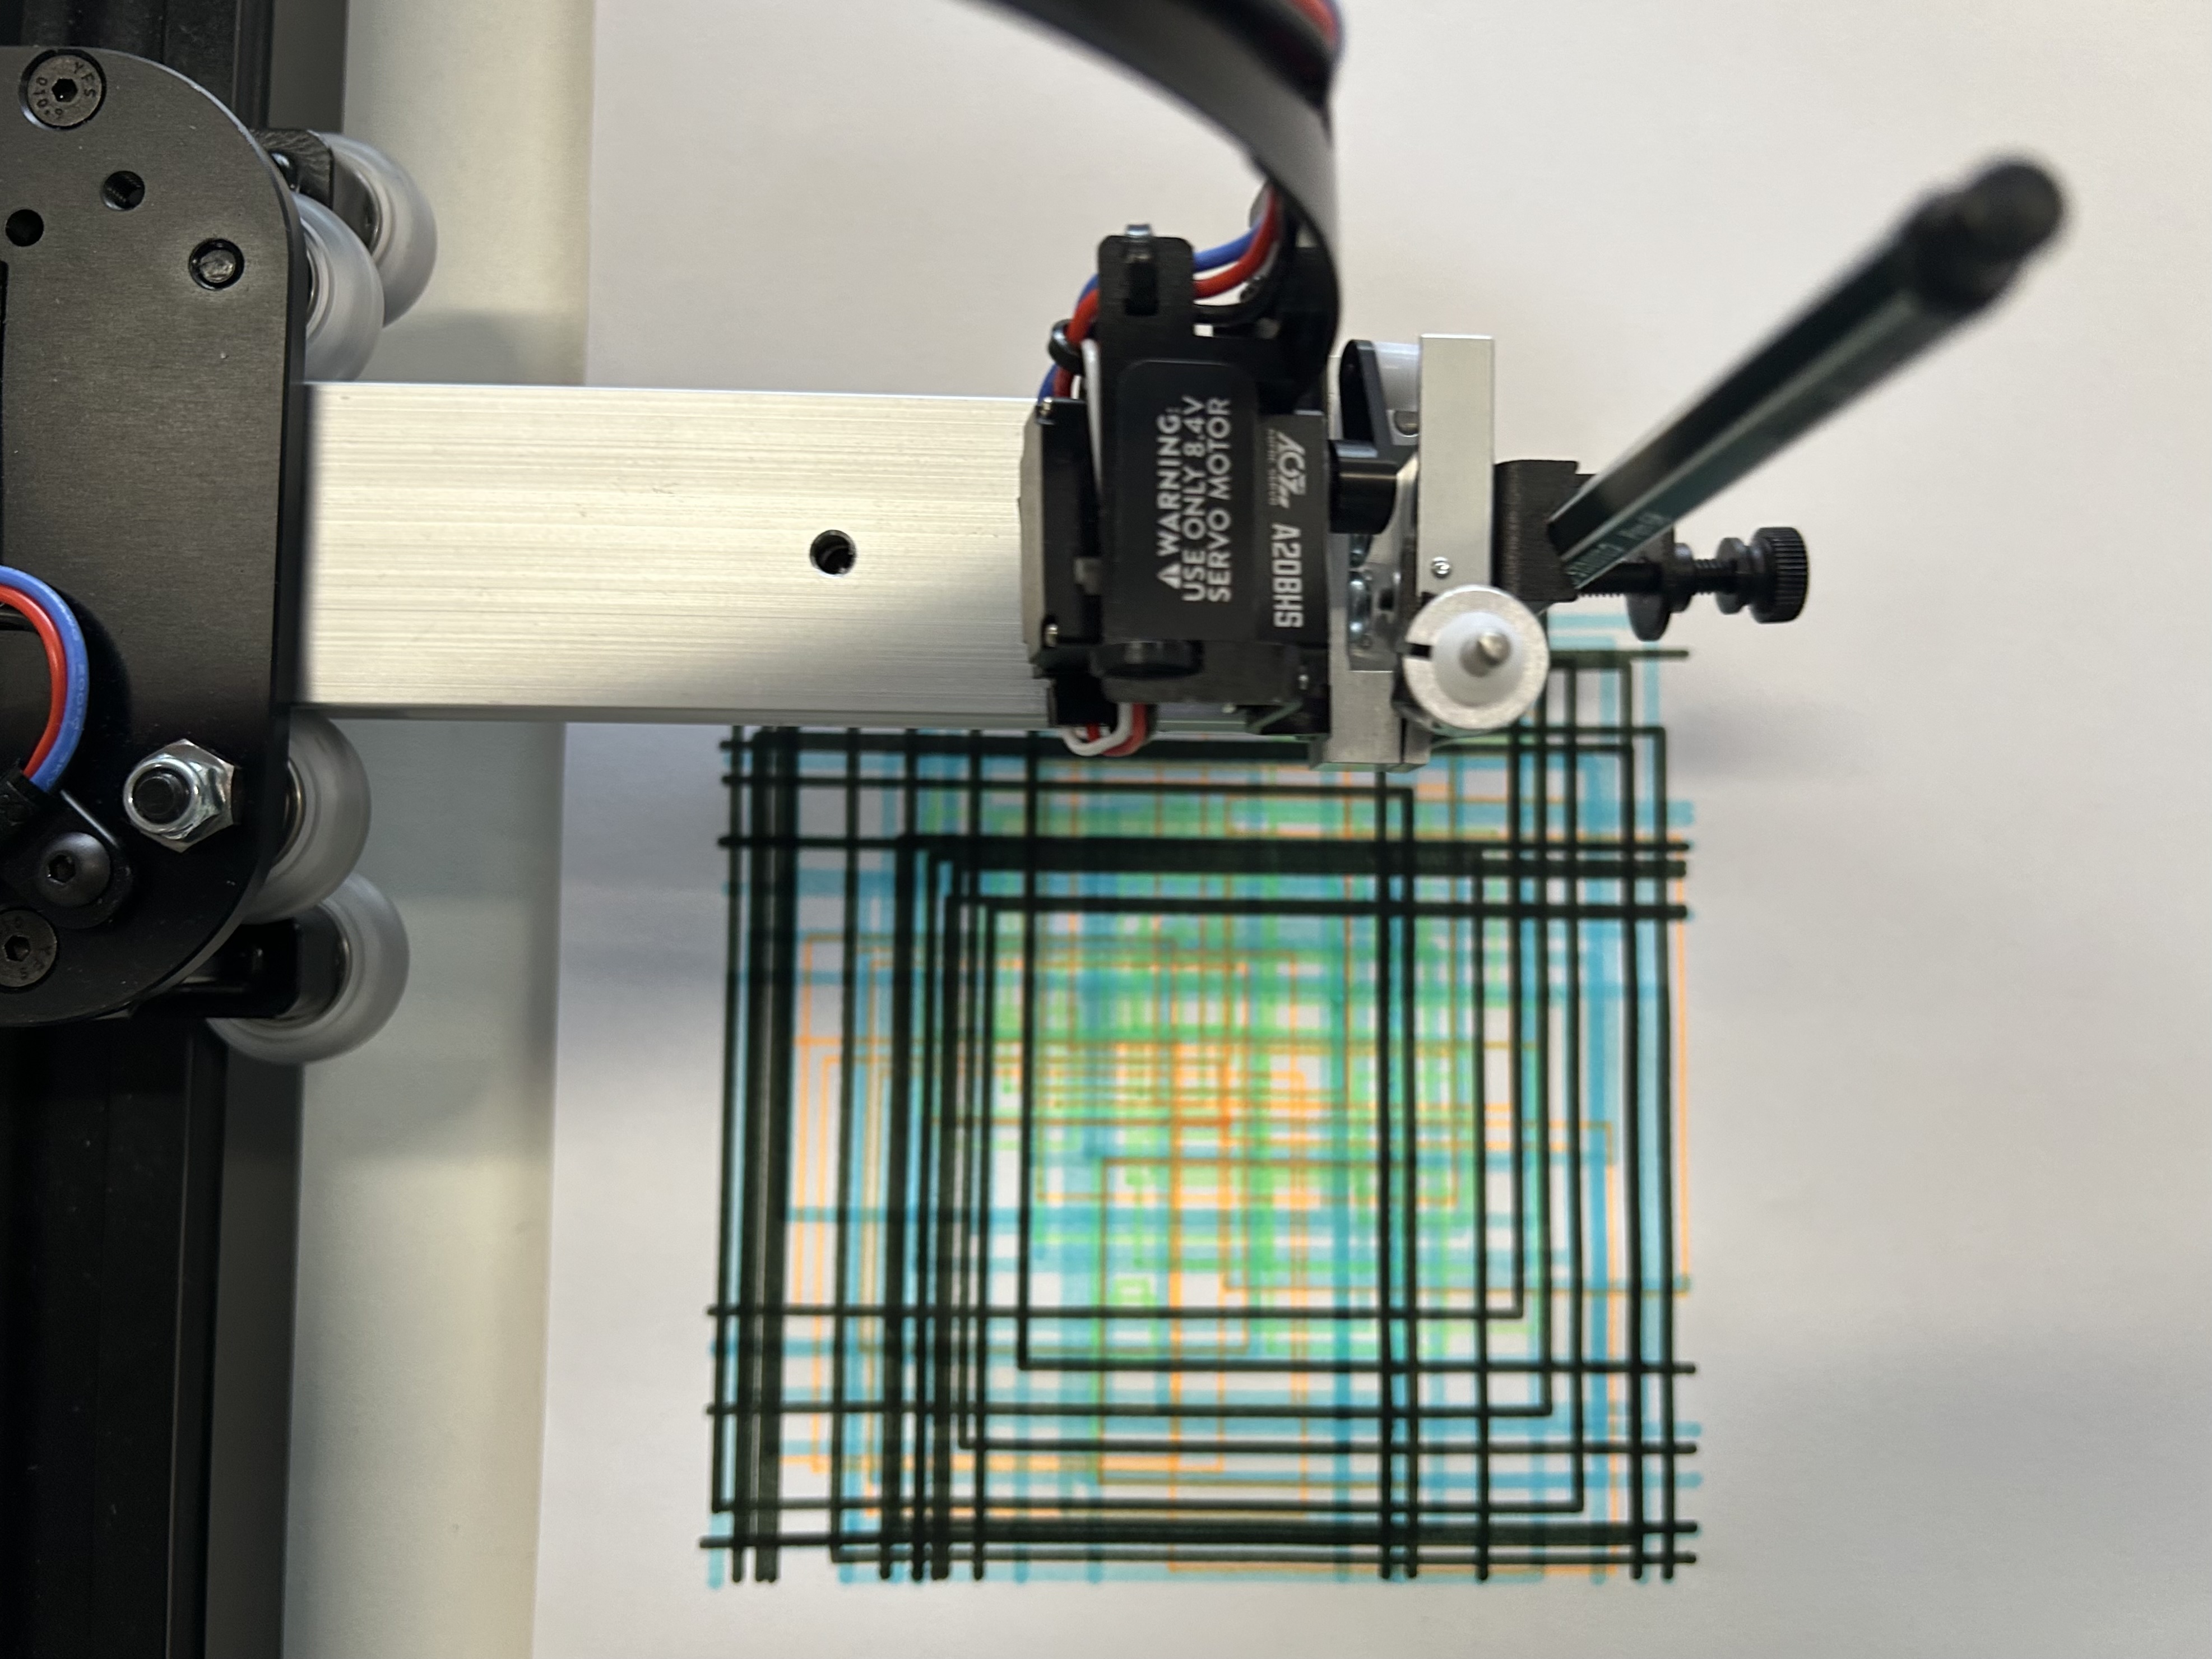
A lot of the development only really became fun once the app started talking to the pen plotter.
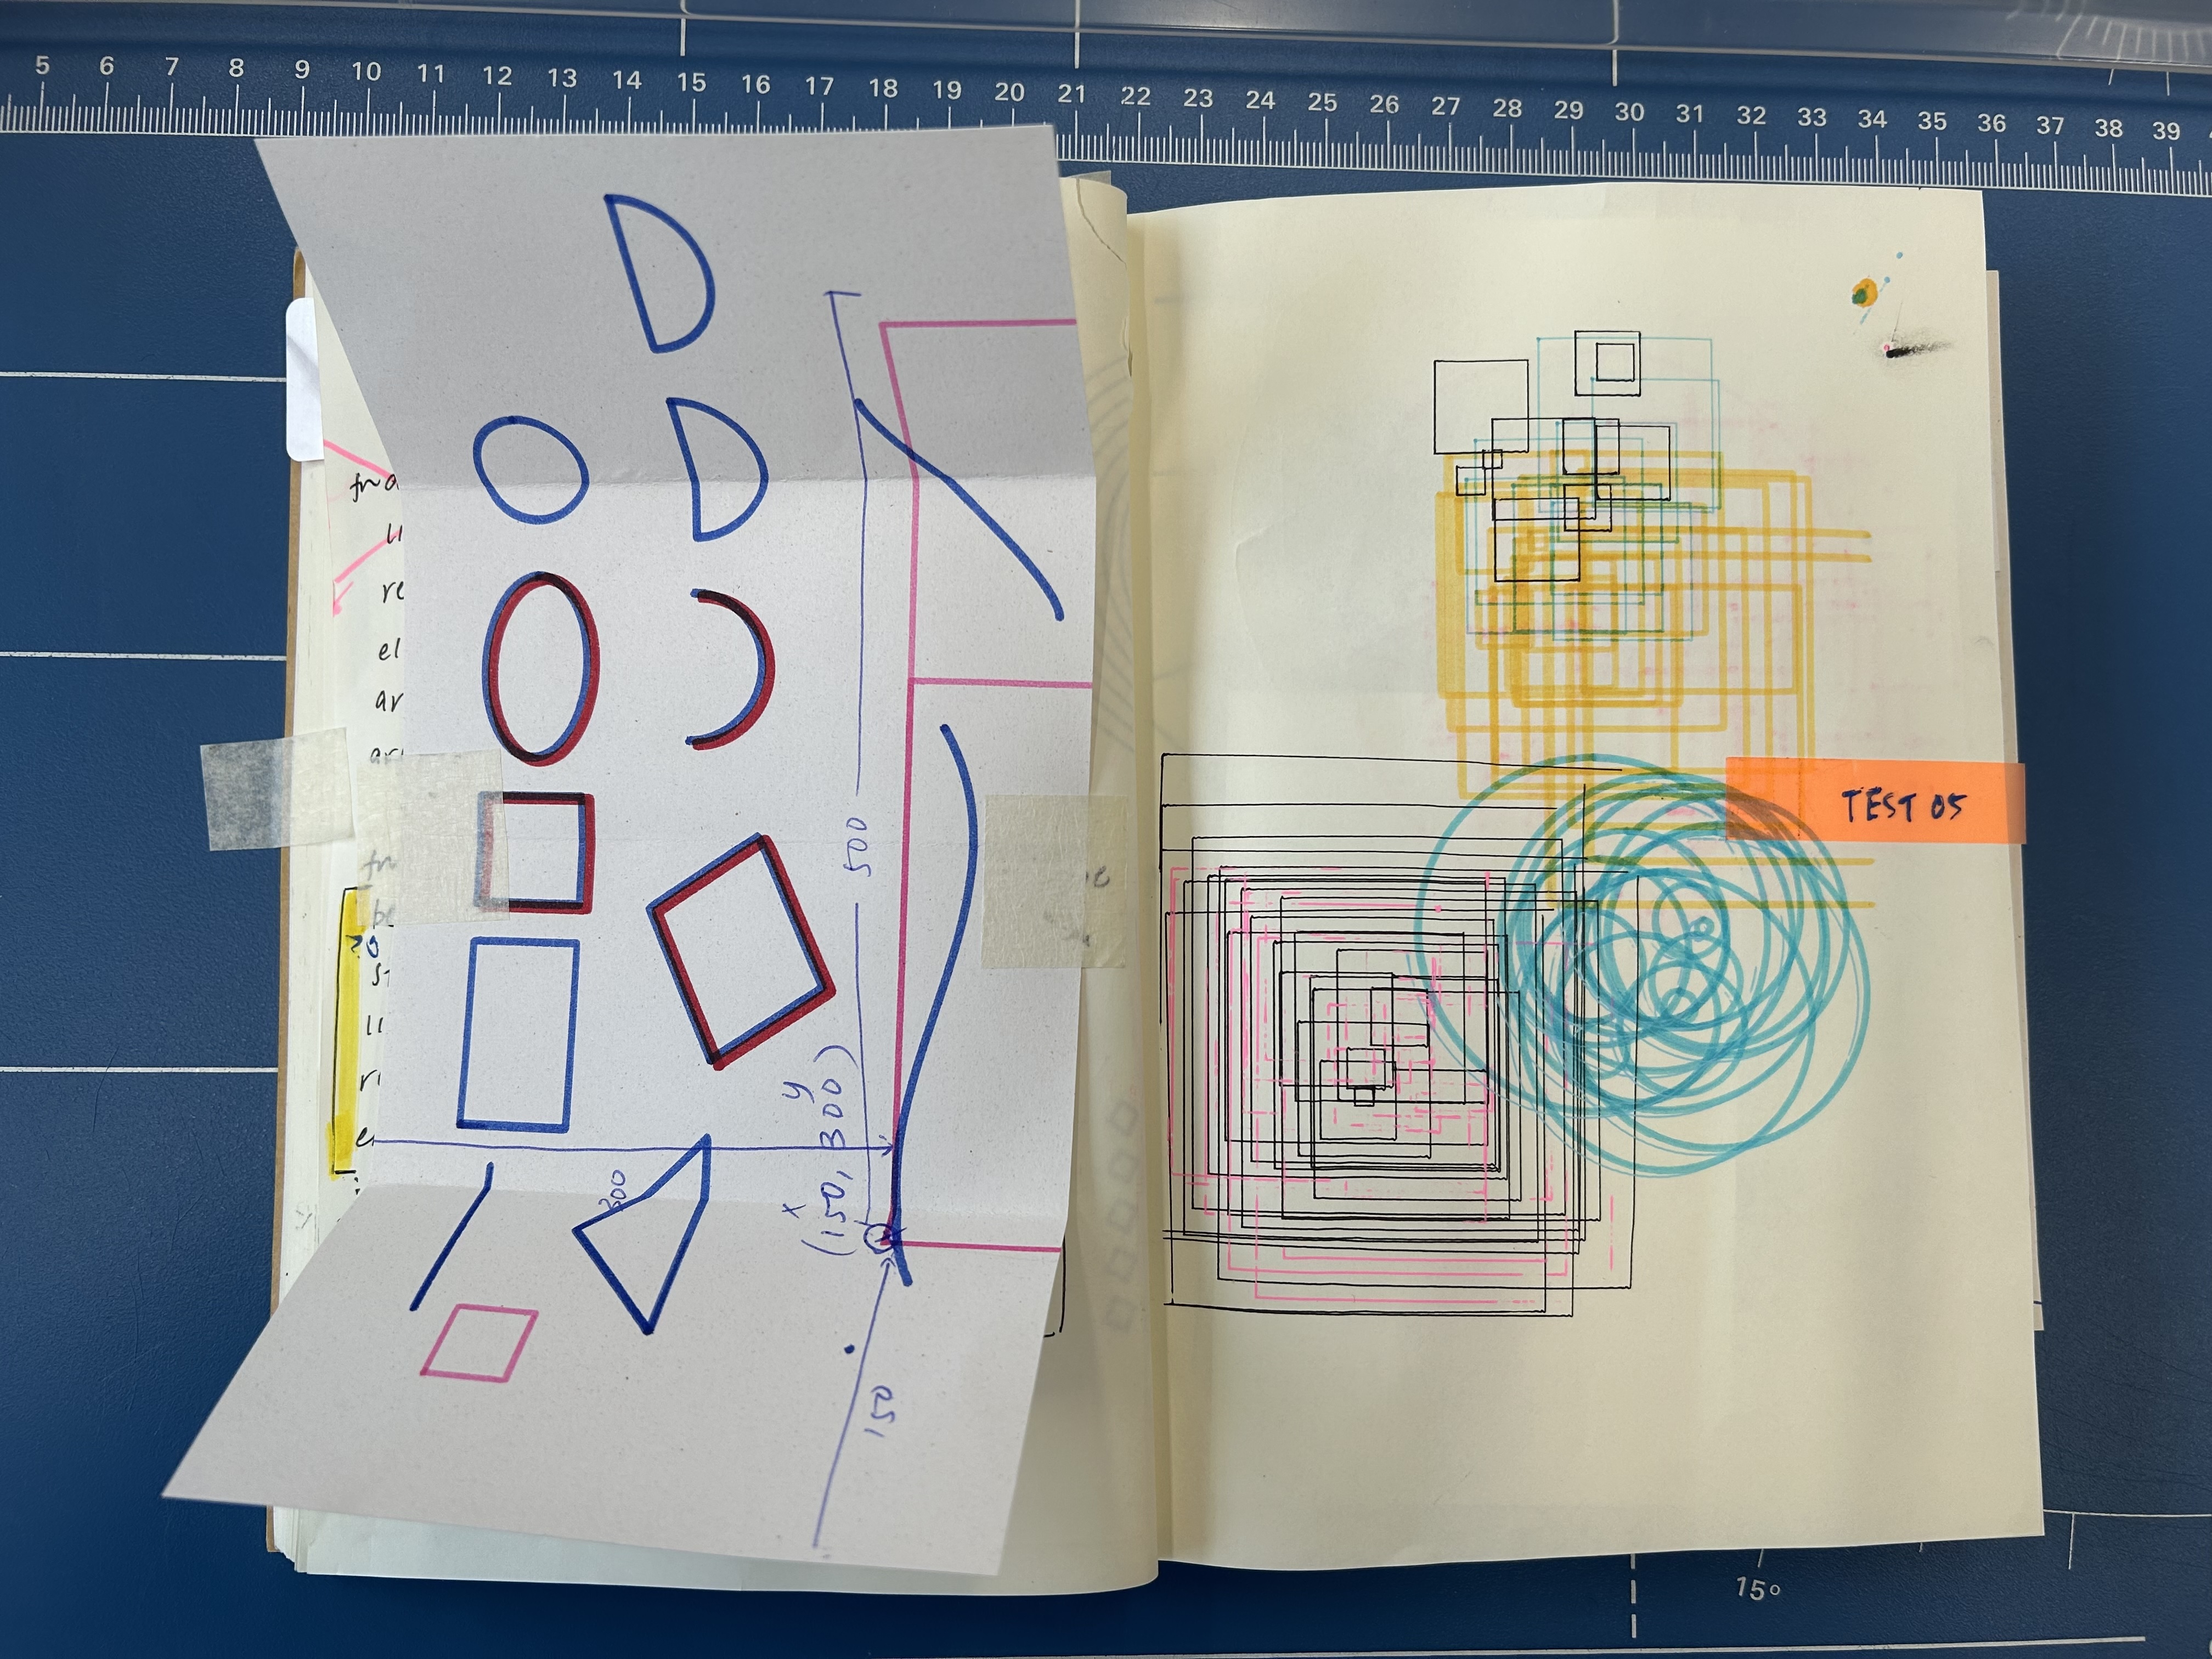
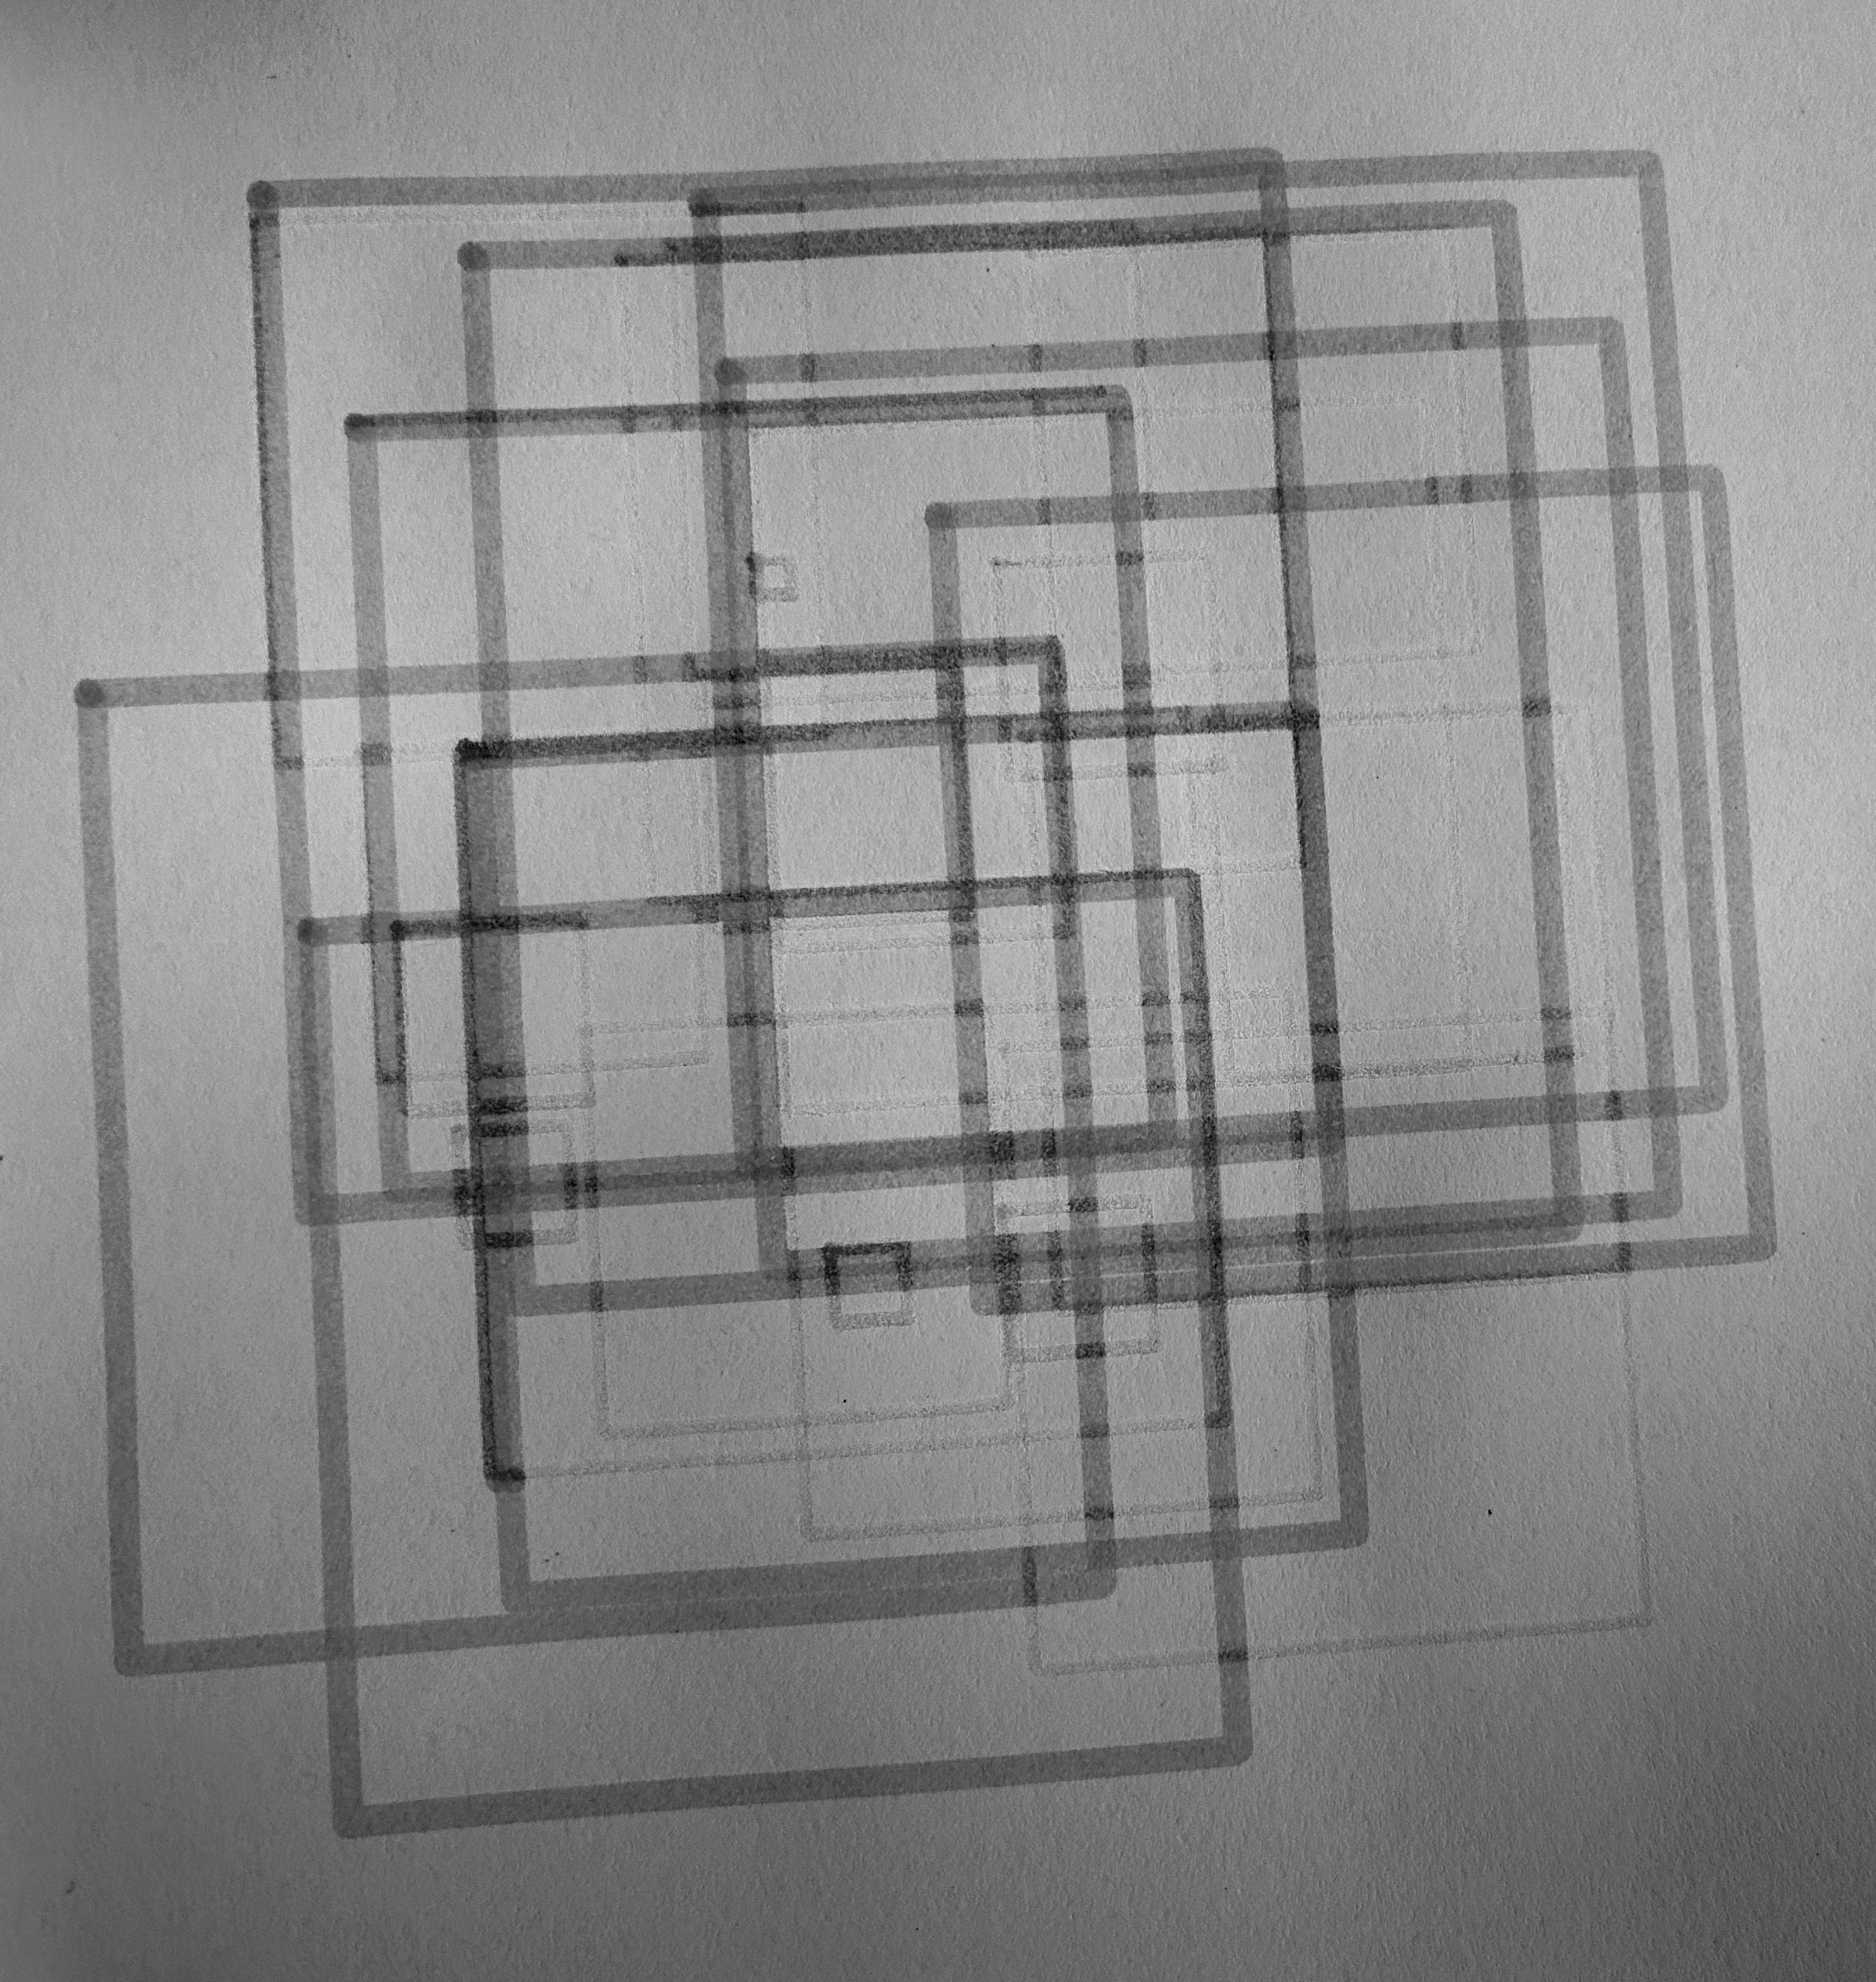
I spent quite a bit of time running small test plots to make sure the basic pipeline was behaving the way I expected. The first milestone was simply getting a line drawn from code all the way through to the plotter on paper.
One of the early test plots tore a page in my journal. I’d miscalculated the canvas size, so the plotter dutifully carried on drawing beyond the edge of the paper. Thankfully, my journal survived the rest of the tests.
Once I got the drawing working, I moved on to testing other features like plotting layers, switching pens, pausing a plot midway, and resuming the session afterwards.

What’s Next
There are still a few ideas I’d like to explore. I want to support more custom plotting scripts, so the pen plotter can respond to events while a drawing is running. I am interested in experimenting with how the plotter responds to events like listening for data, reacting to external inputs, and modifying the drawing process in real time. There’s a lot of interesting territory in treating them more like interactive machines.
I will probably also continue refining parts of the interface as I keep using the tool. I’ve been using it to run my creative coding and drawing with machines workshops and it holds up pretty well. If you are curious, the tool is open source and the repository includes all the information on how to get the tool up and running.