Atlas of Intangibles
Our personal memories of a place are situated in fleeting sensory experiences – the waft of the petrichor, bird songs scoring the background, bakery aromas, sounds of traffic and footfalls whizzing by. This interplay between our senses structures and mediates our sense of a place.
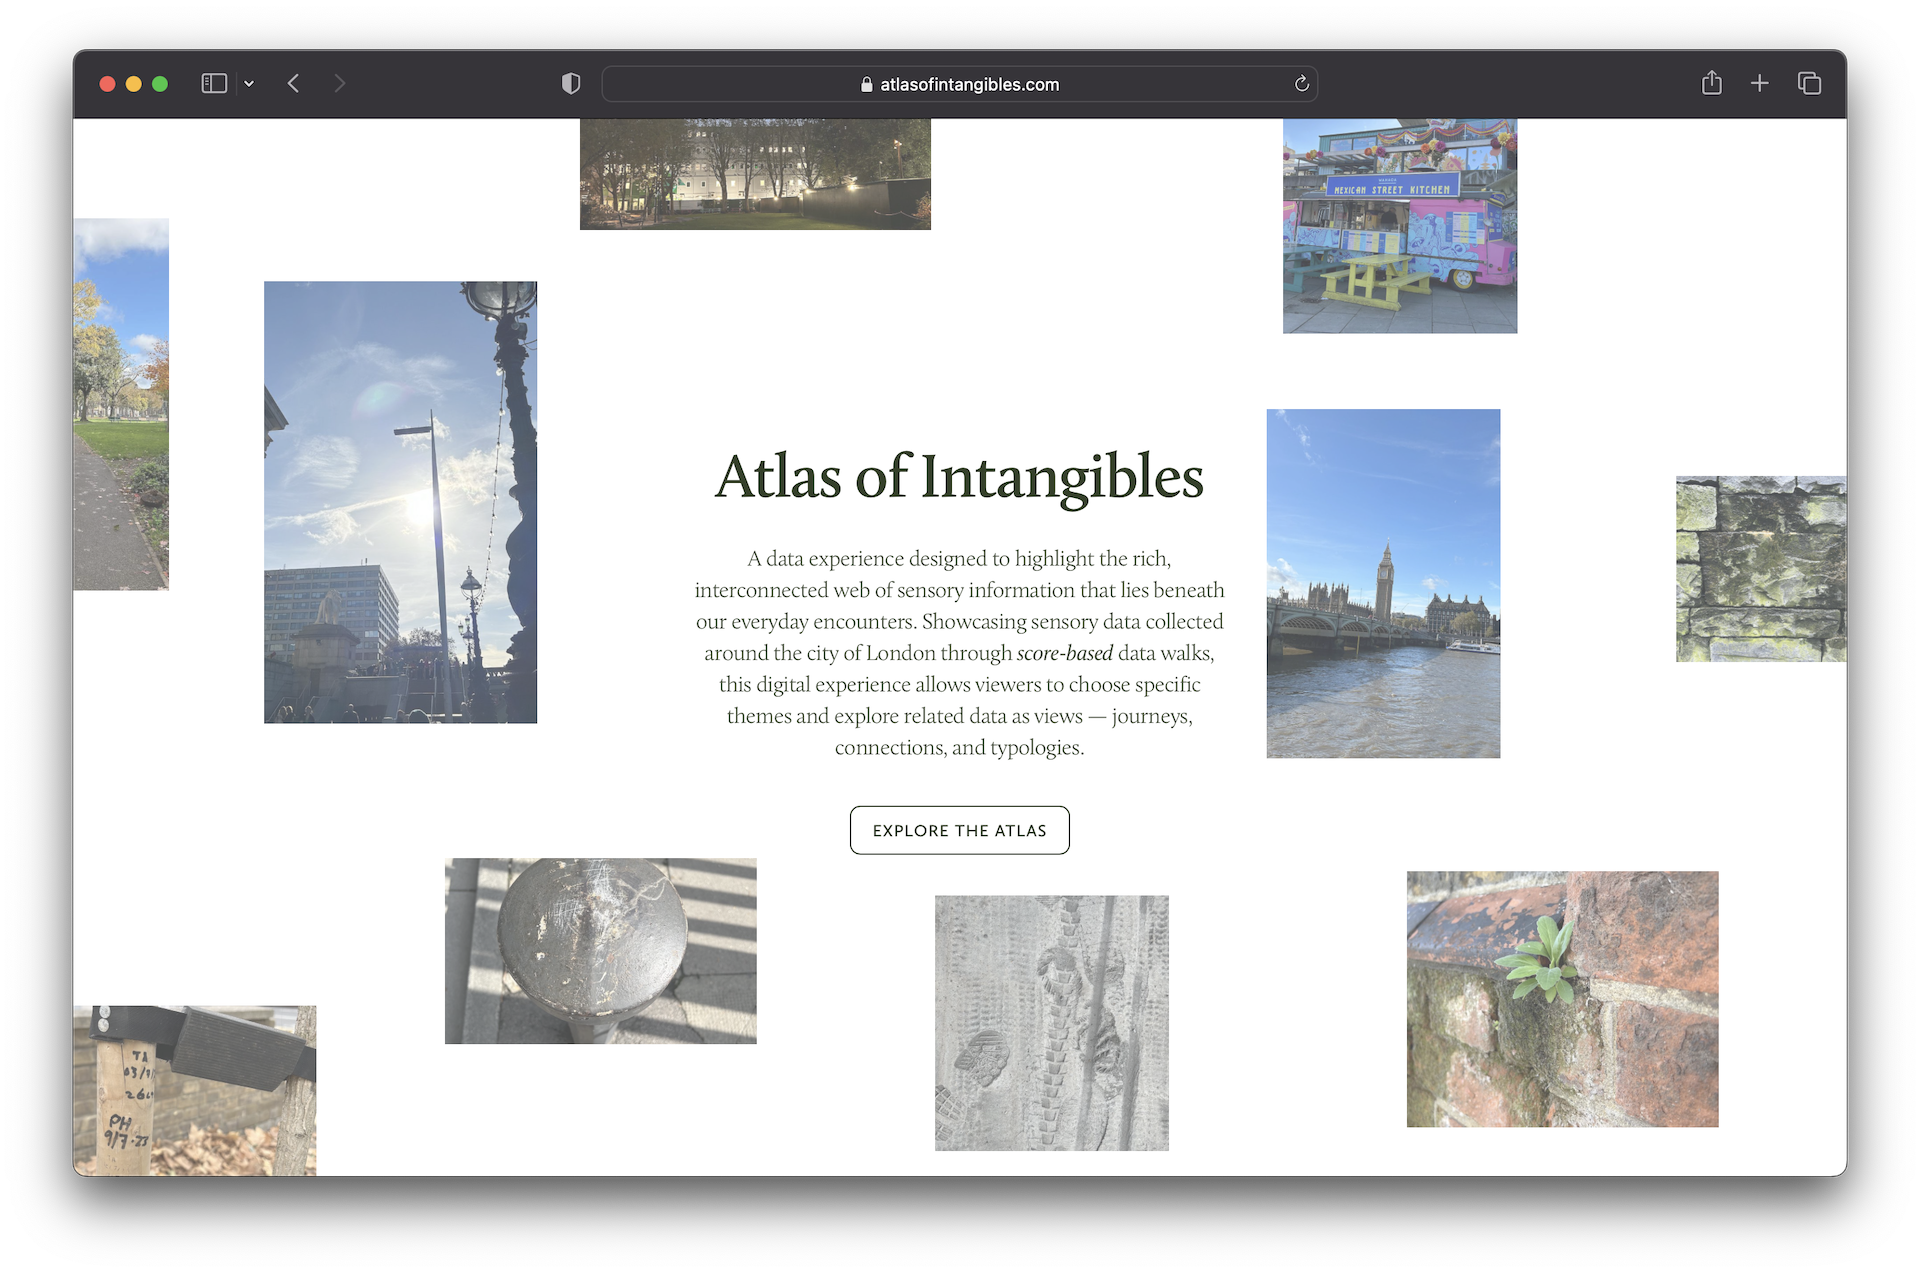
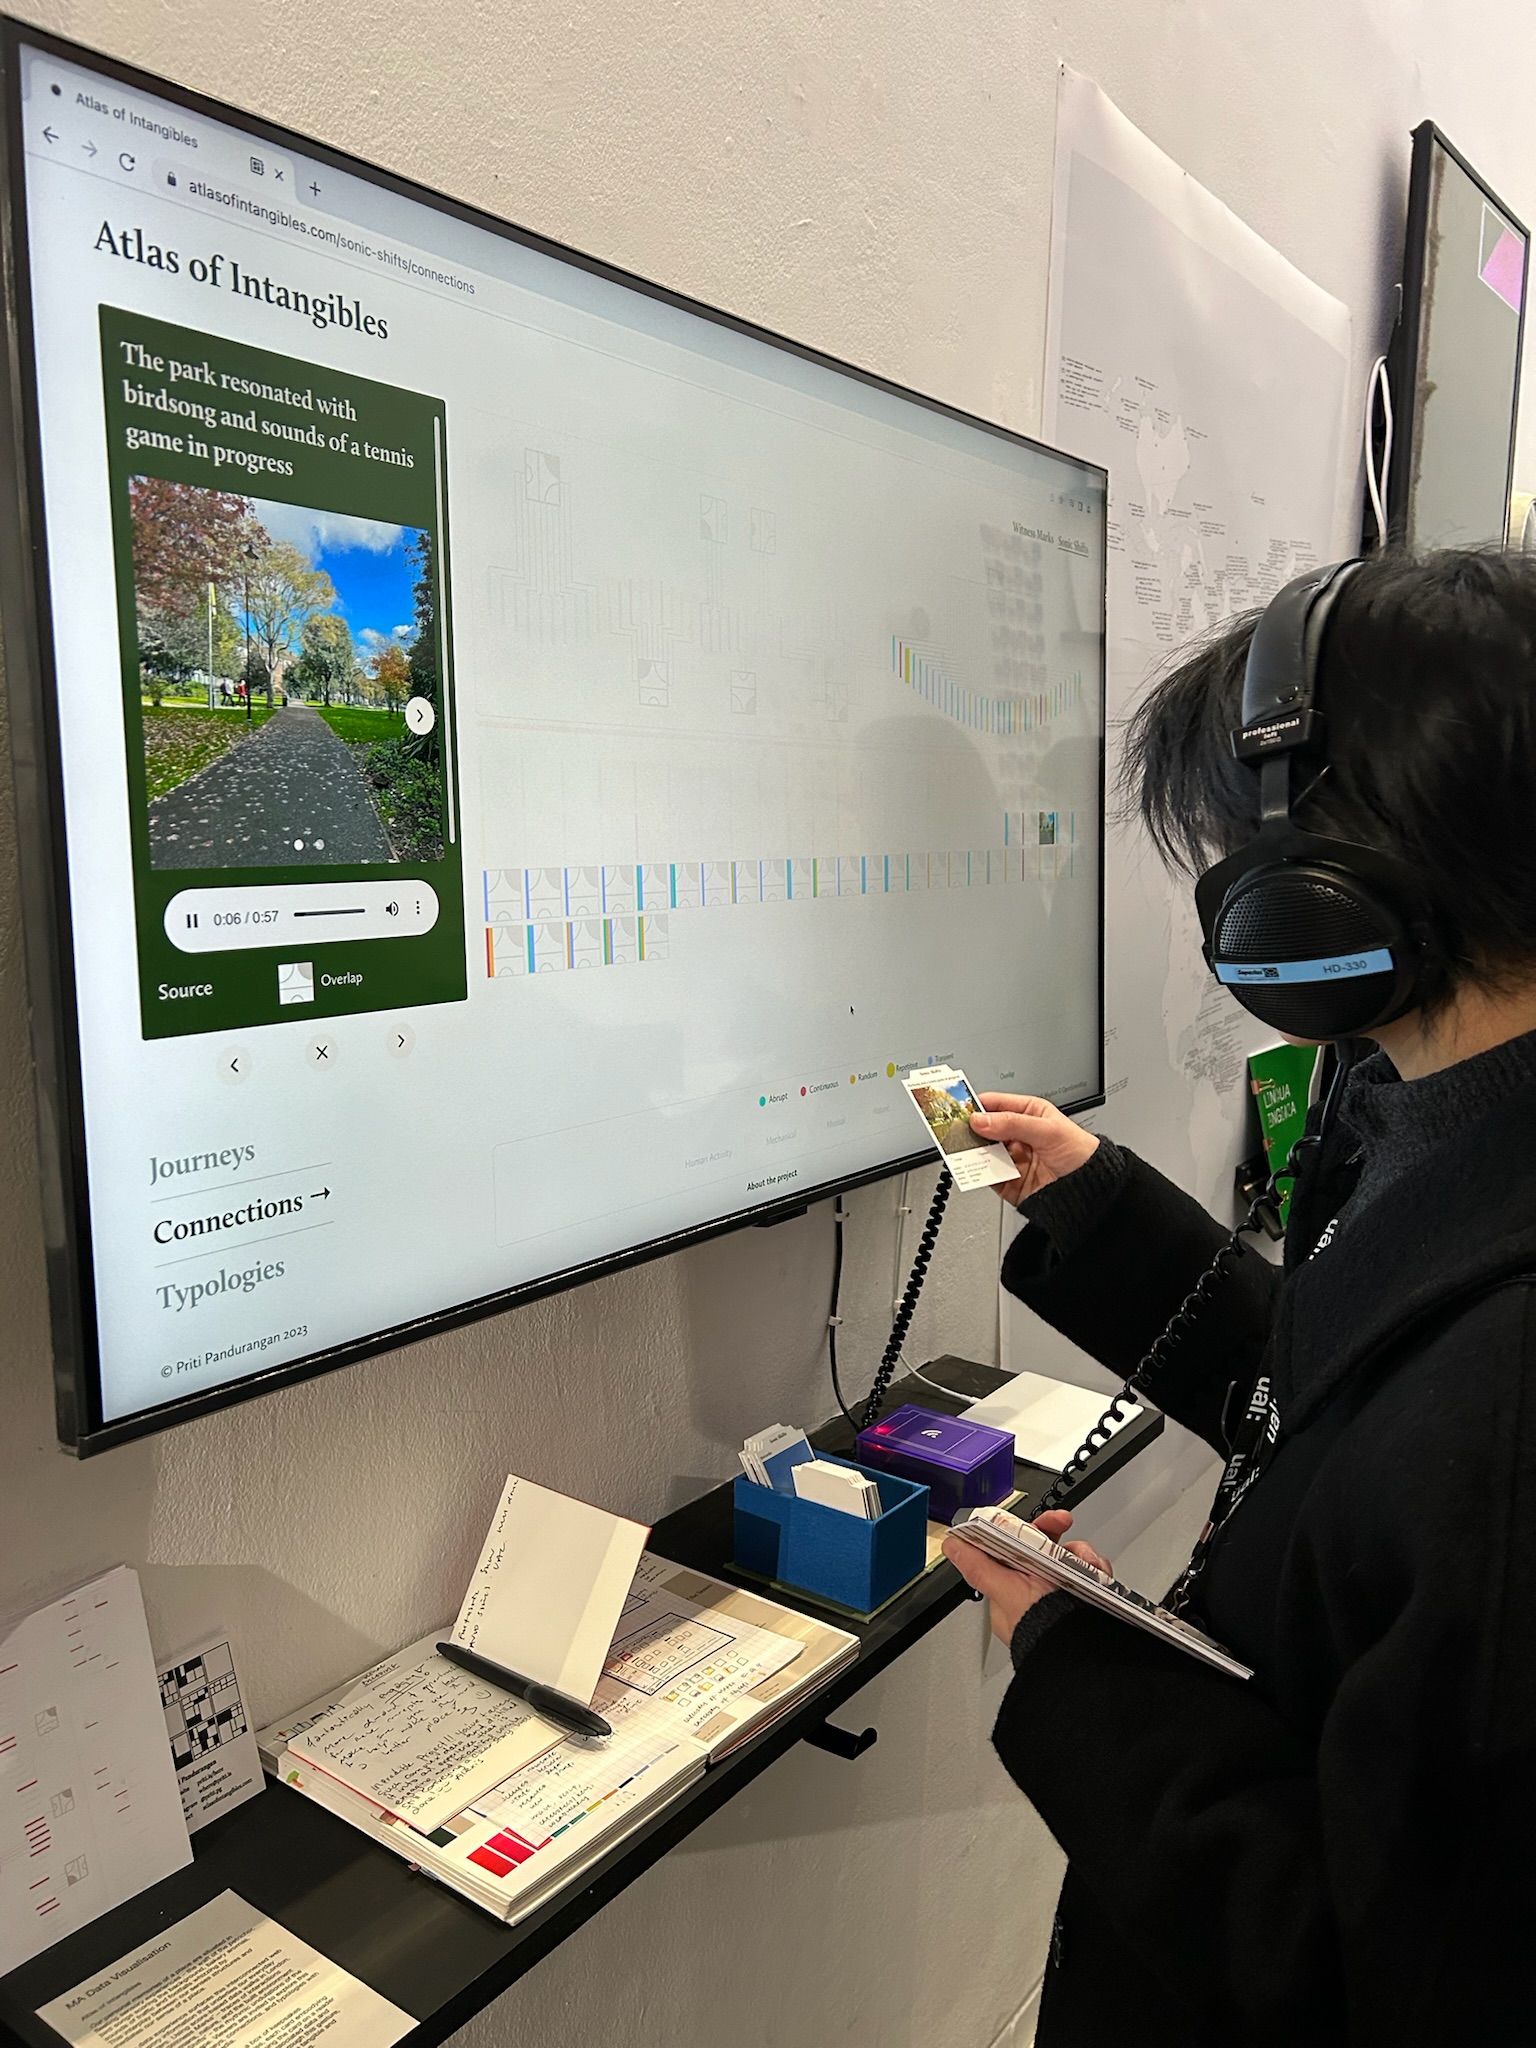
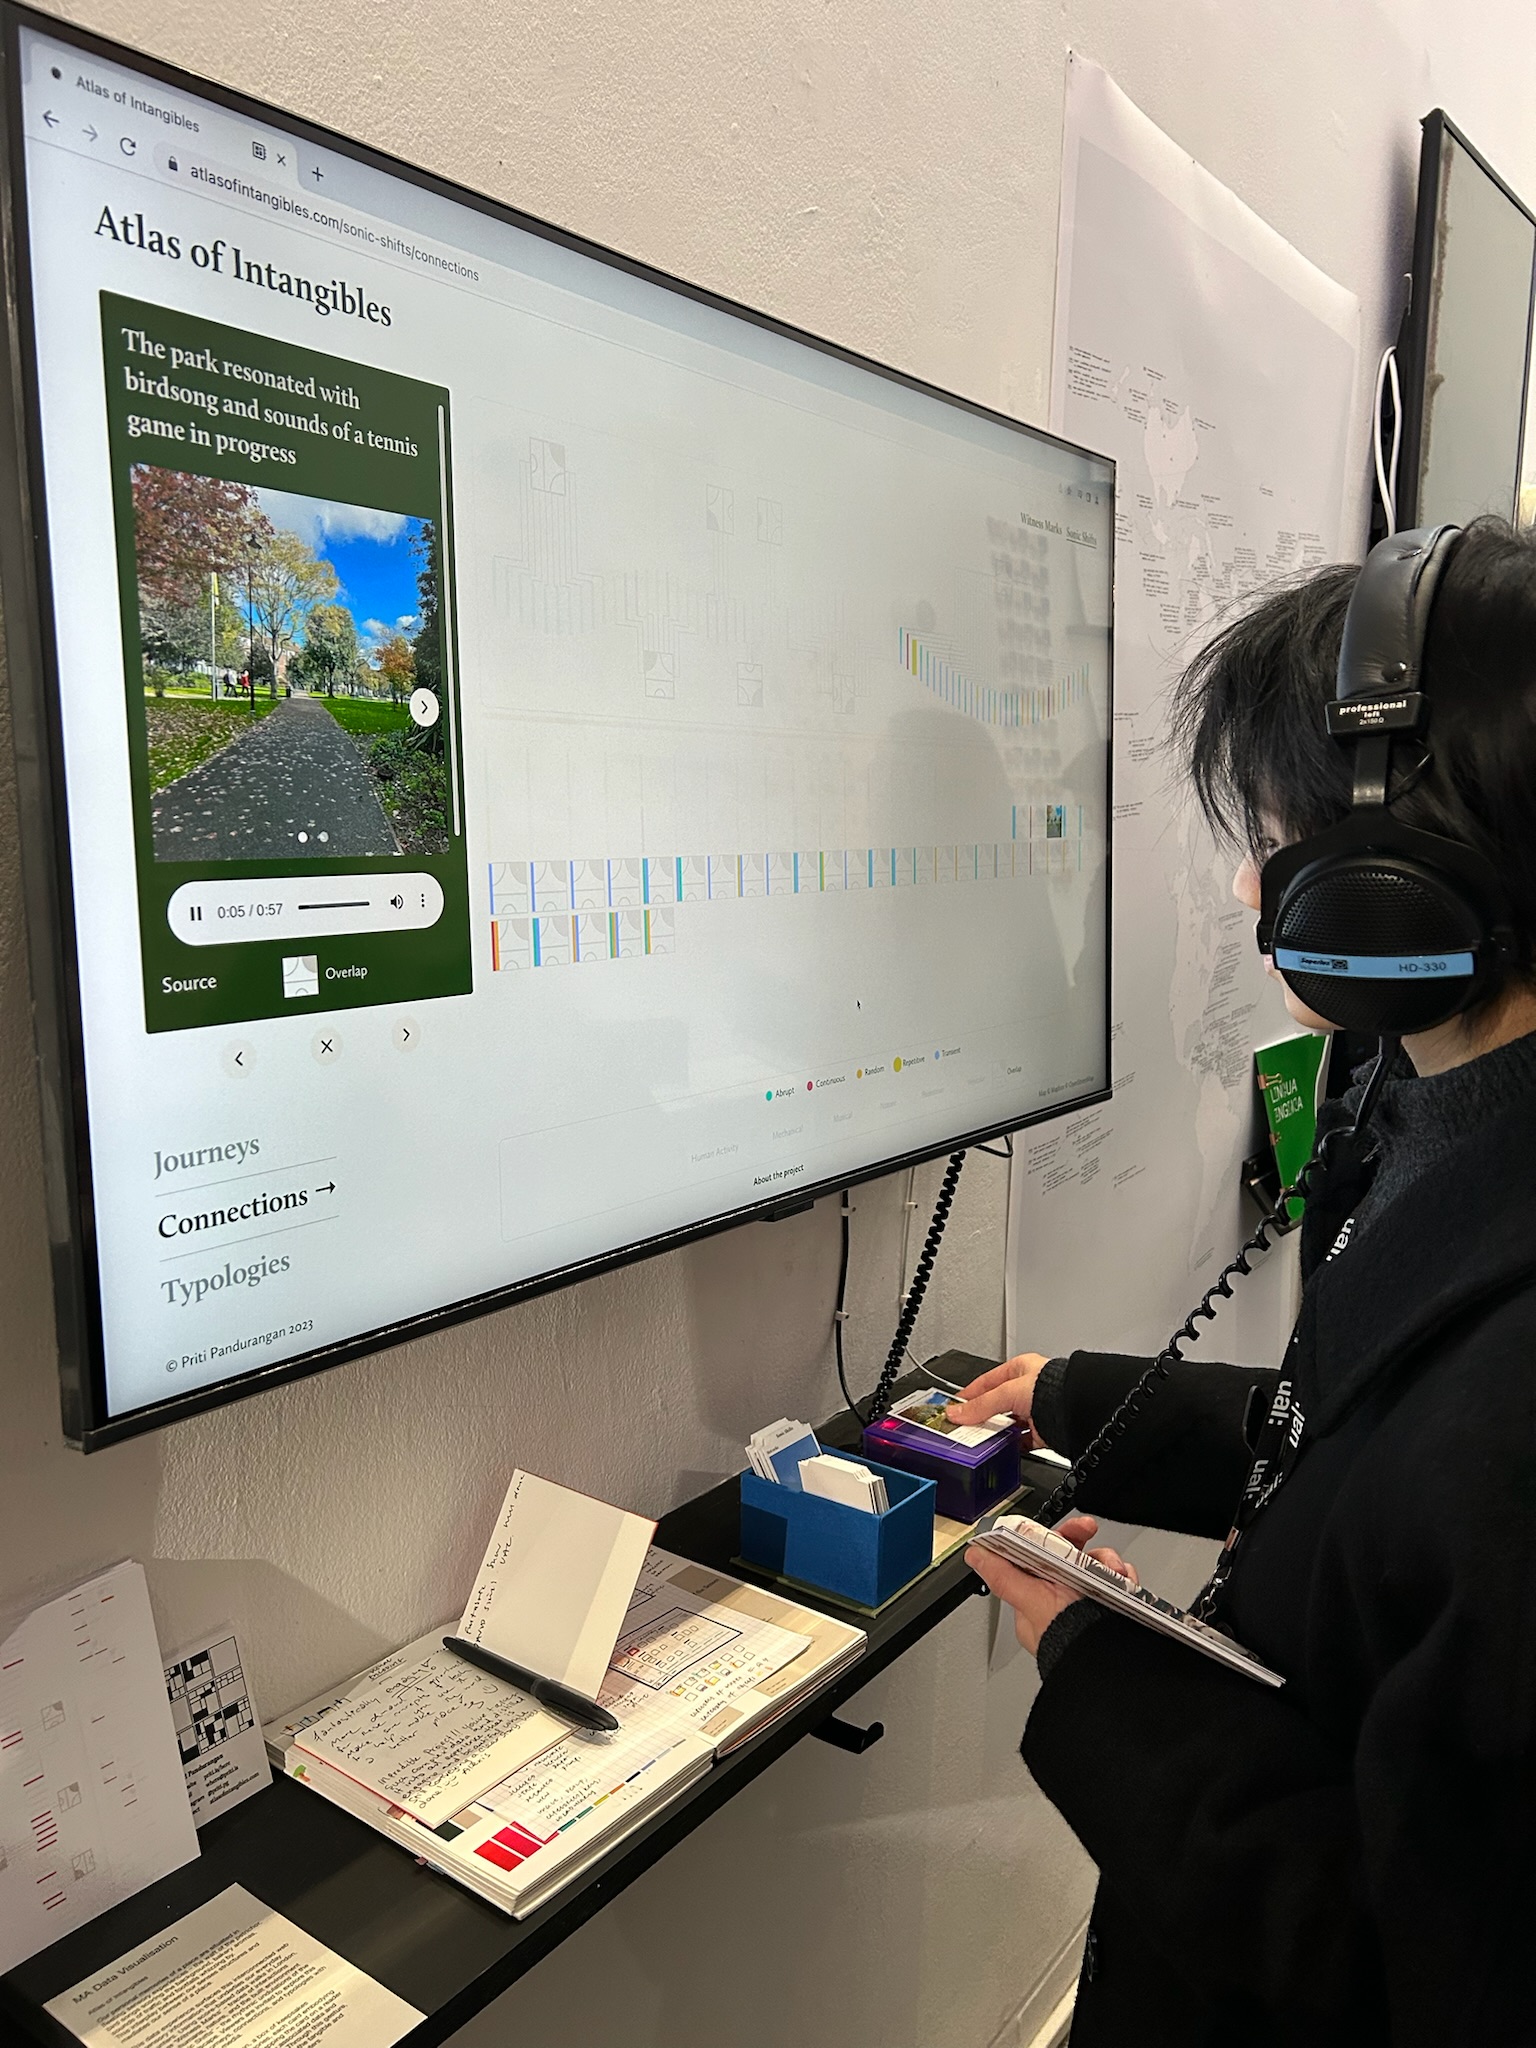
Atlas of Intangibles is a data experience designed to highlight the rich, interconnected web of sensory information that lies beneath our everyday encounters. Showcasing sensory data collected by me around the city of London through score-based data walks, the digital experience invites viewers to choose specific themes and explore related data as views — journeys, connections, and typologies. Each data point is rich in context, encompassing images & audio recordings.
Walking from Scores
In contemporary art, a protocol is a set of rules employed by artists to create their artwork. Similarly, walking protocols, sometimes referred to as scores in the literature [1], help shape walks by defining how to move and what to observe.
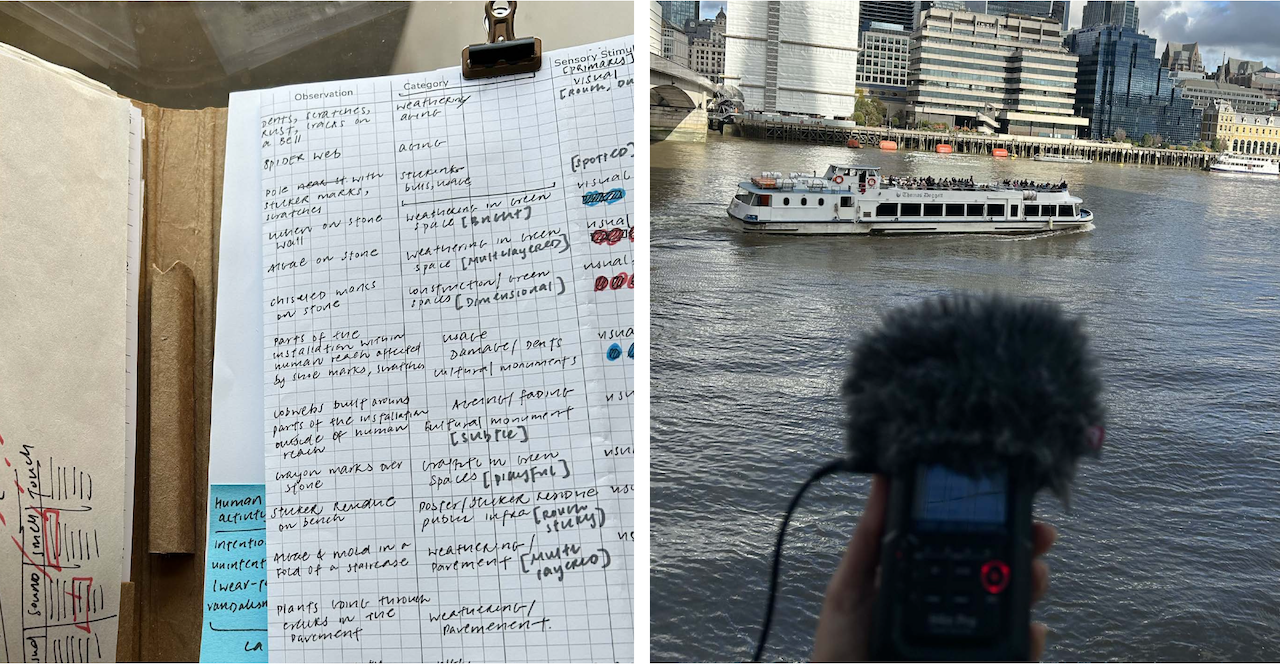
In my data walks, I frame scores as creative instructions designed to nudge the observer to specific slices of their sensory encounters. These scores are modular, adaptable, incorporating elements like field notes, sketches, photography, audio recordings, and videos and can be conducted with or without technological support.


Two Scores, Two Themes
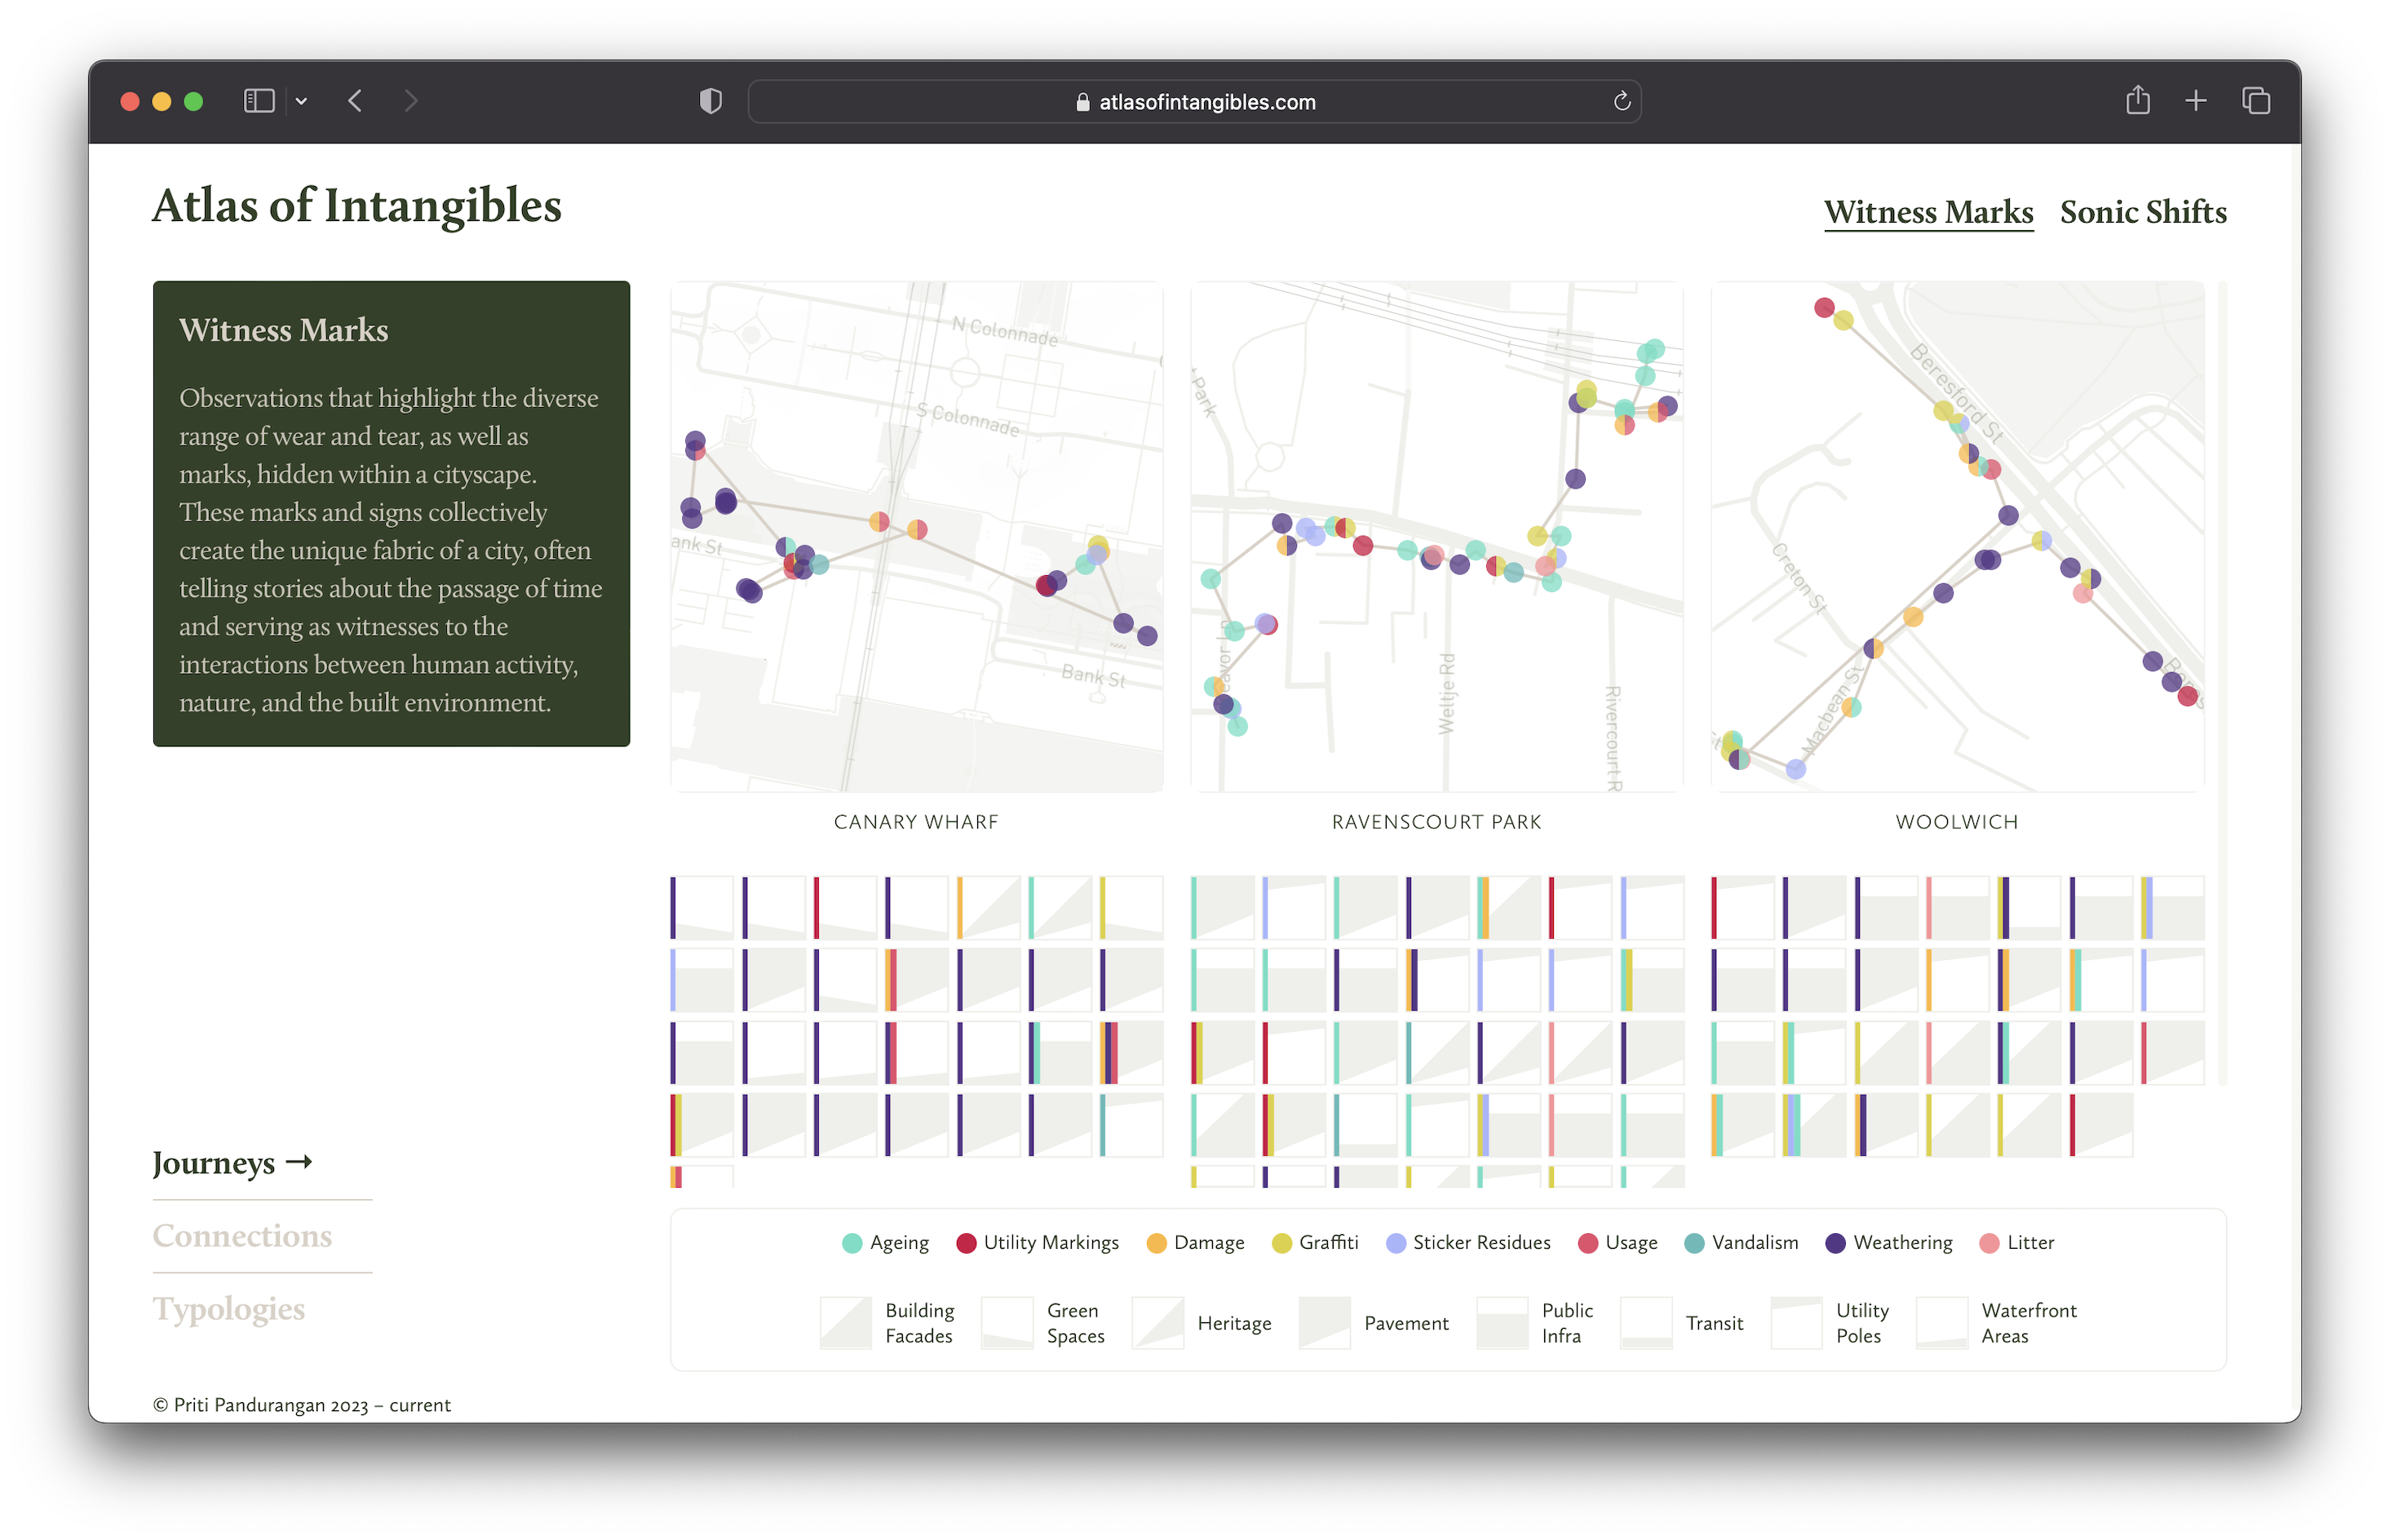
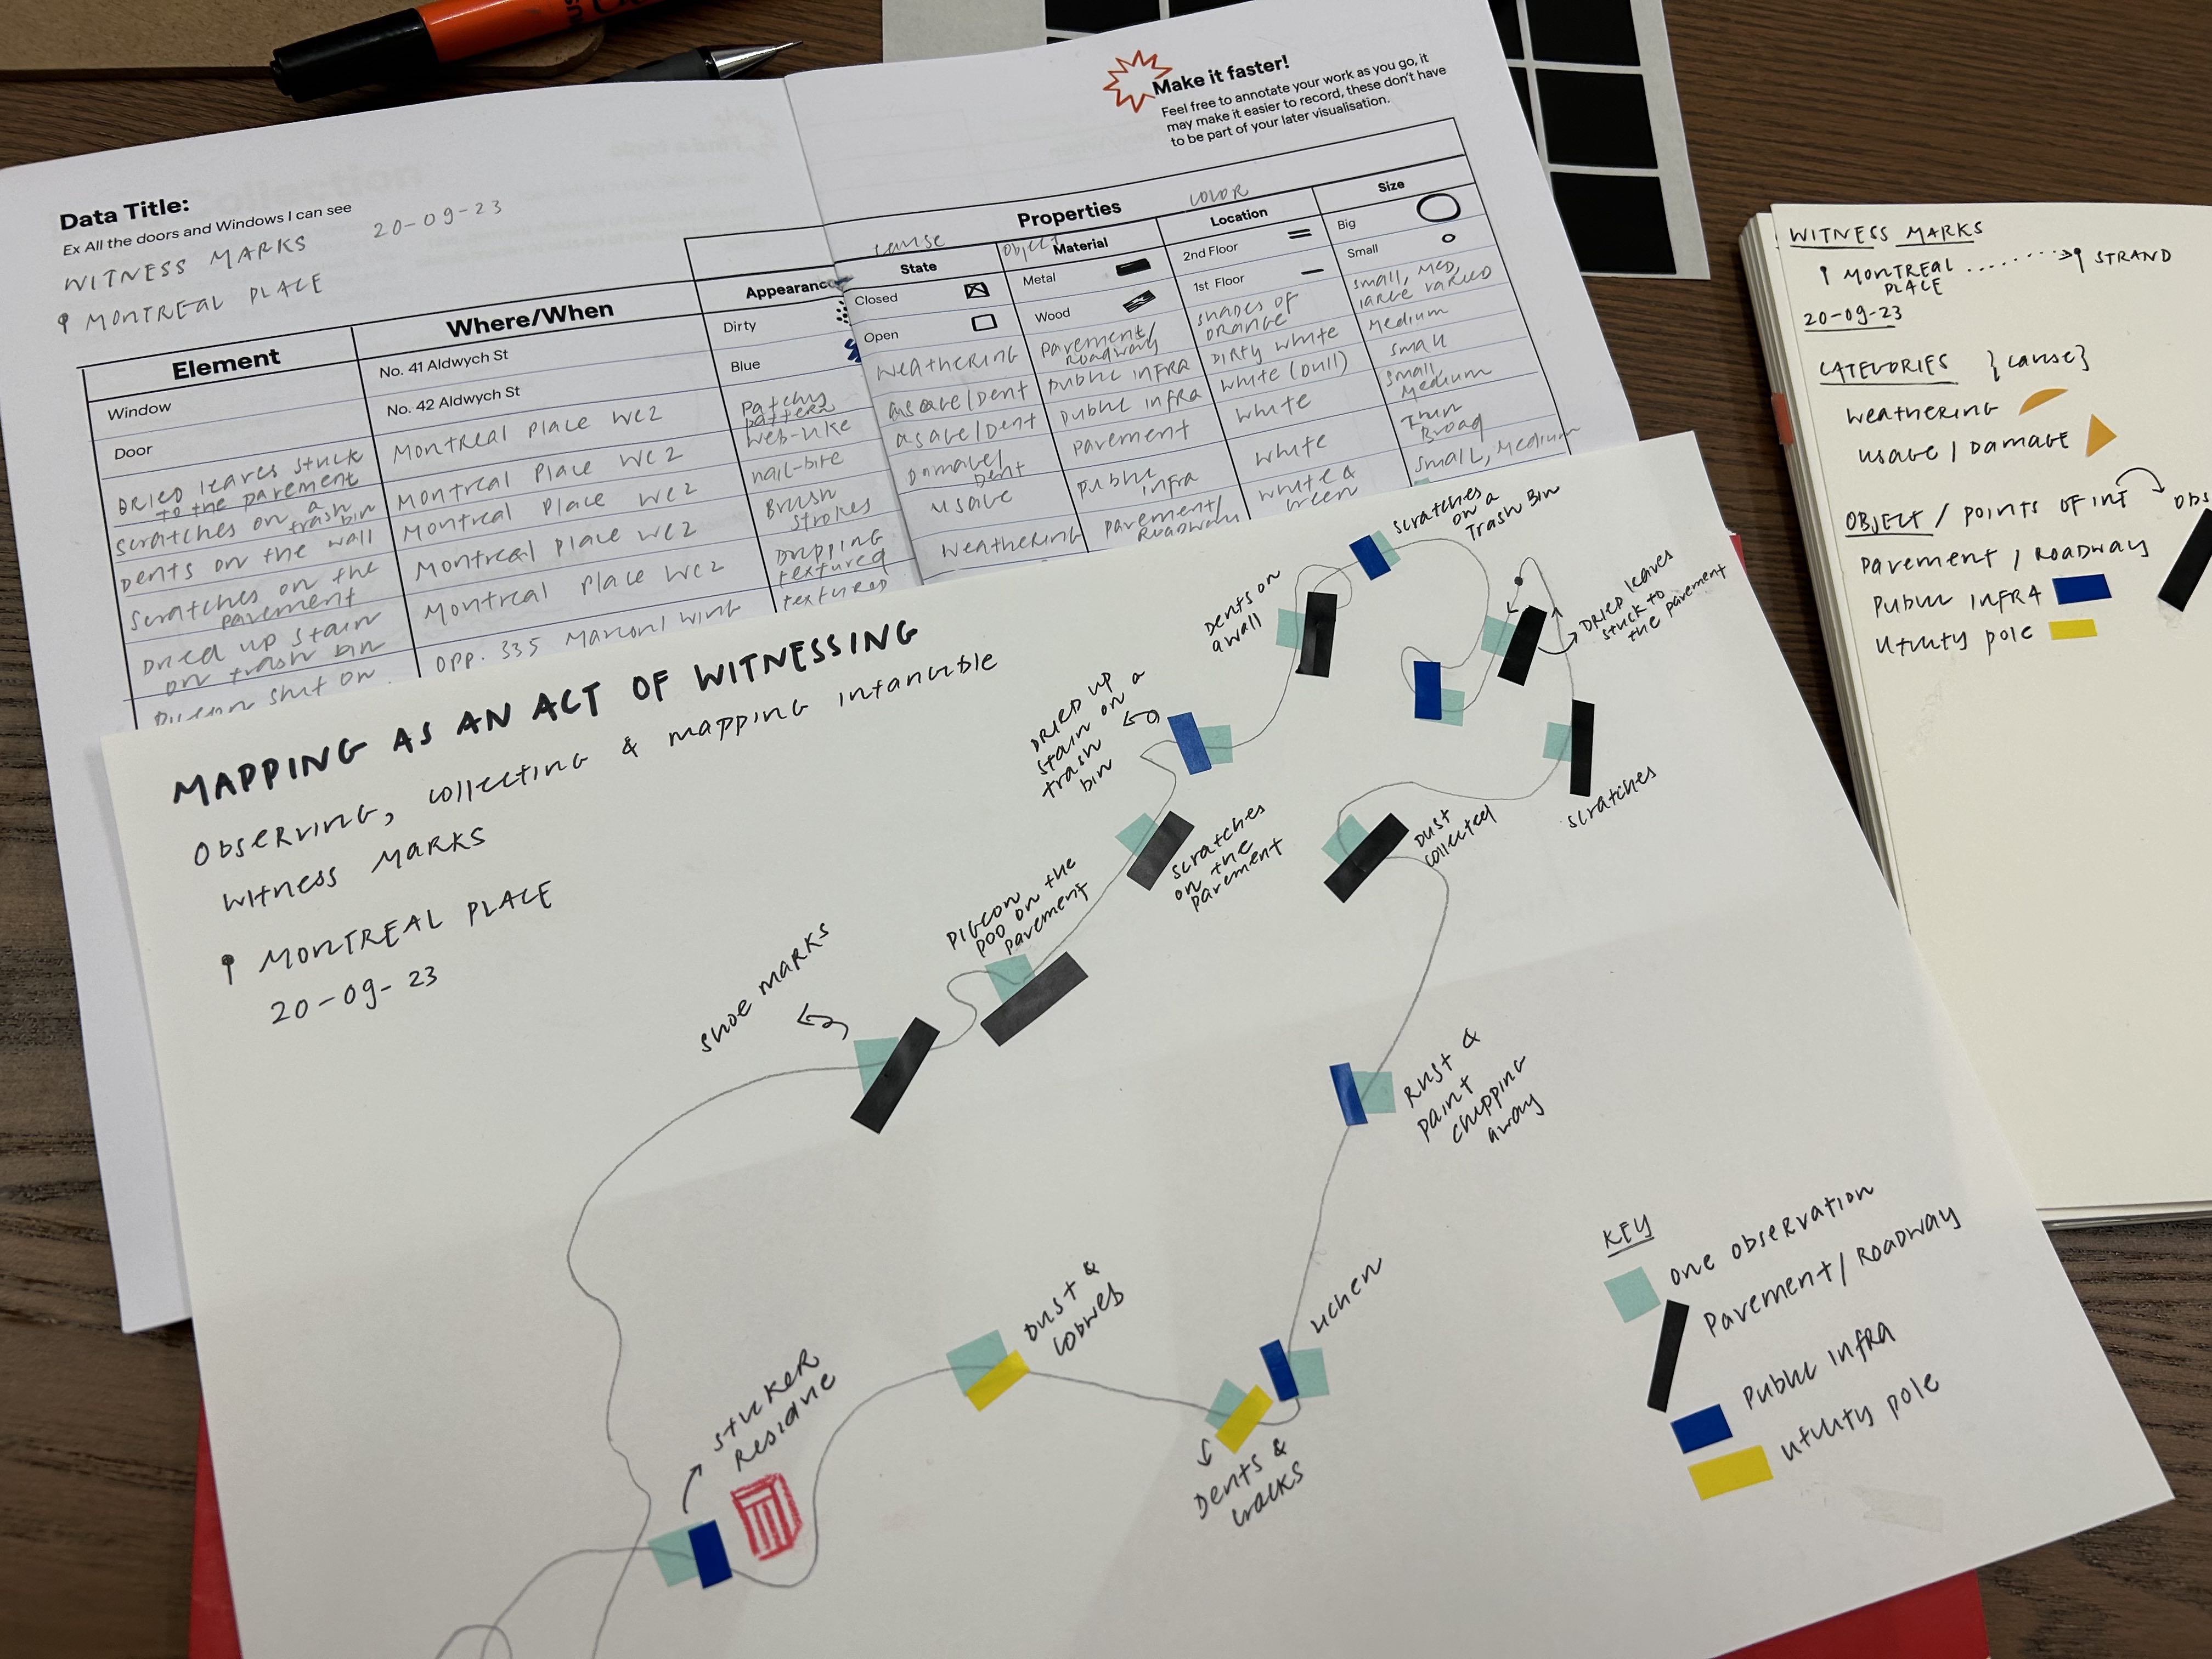
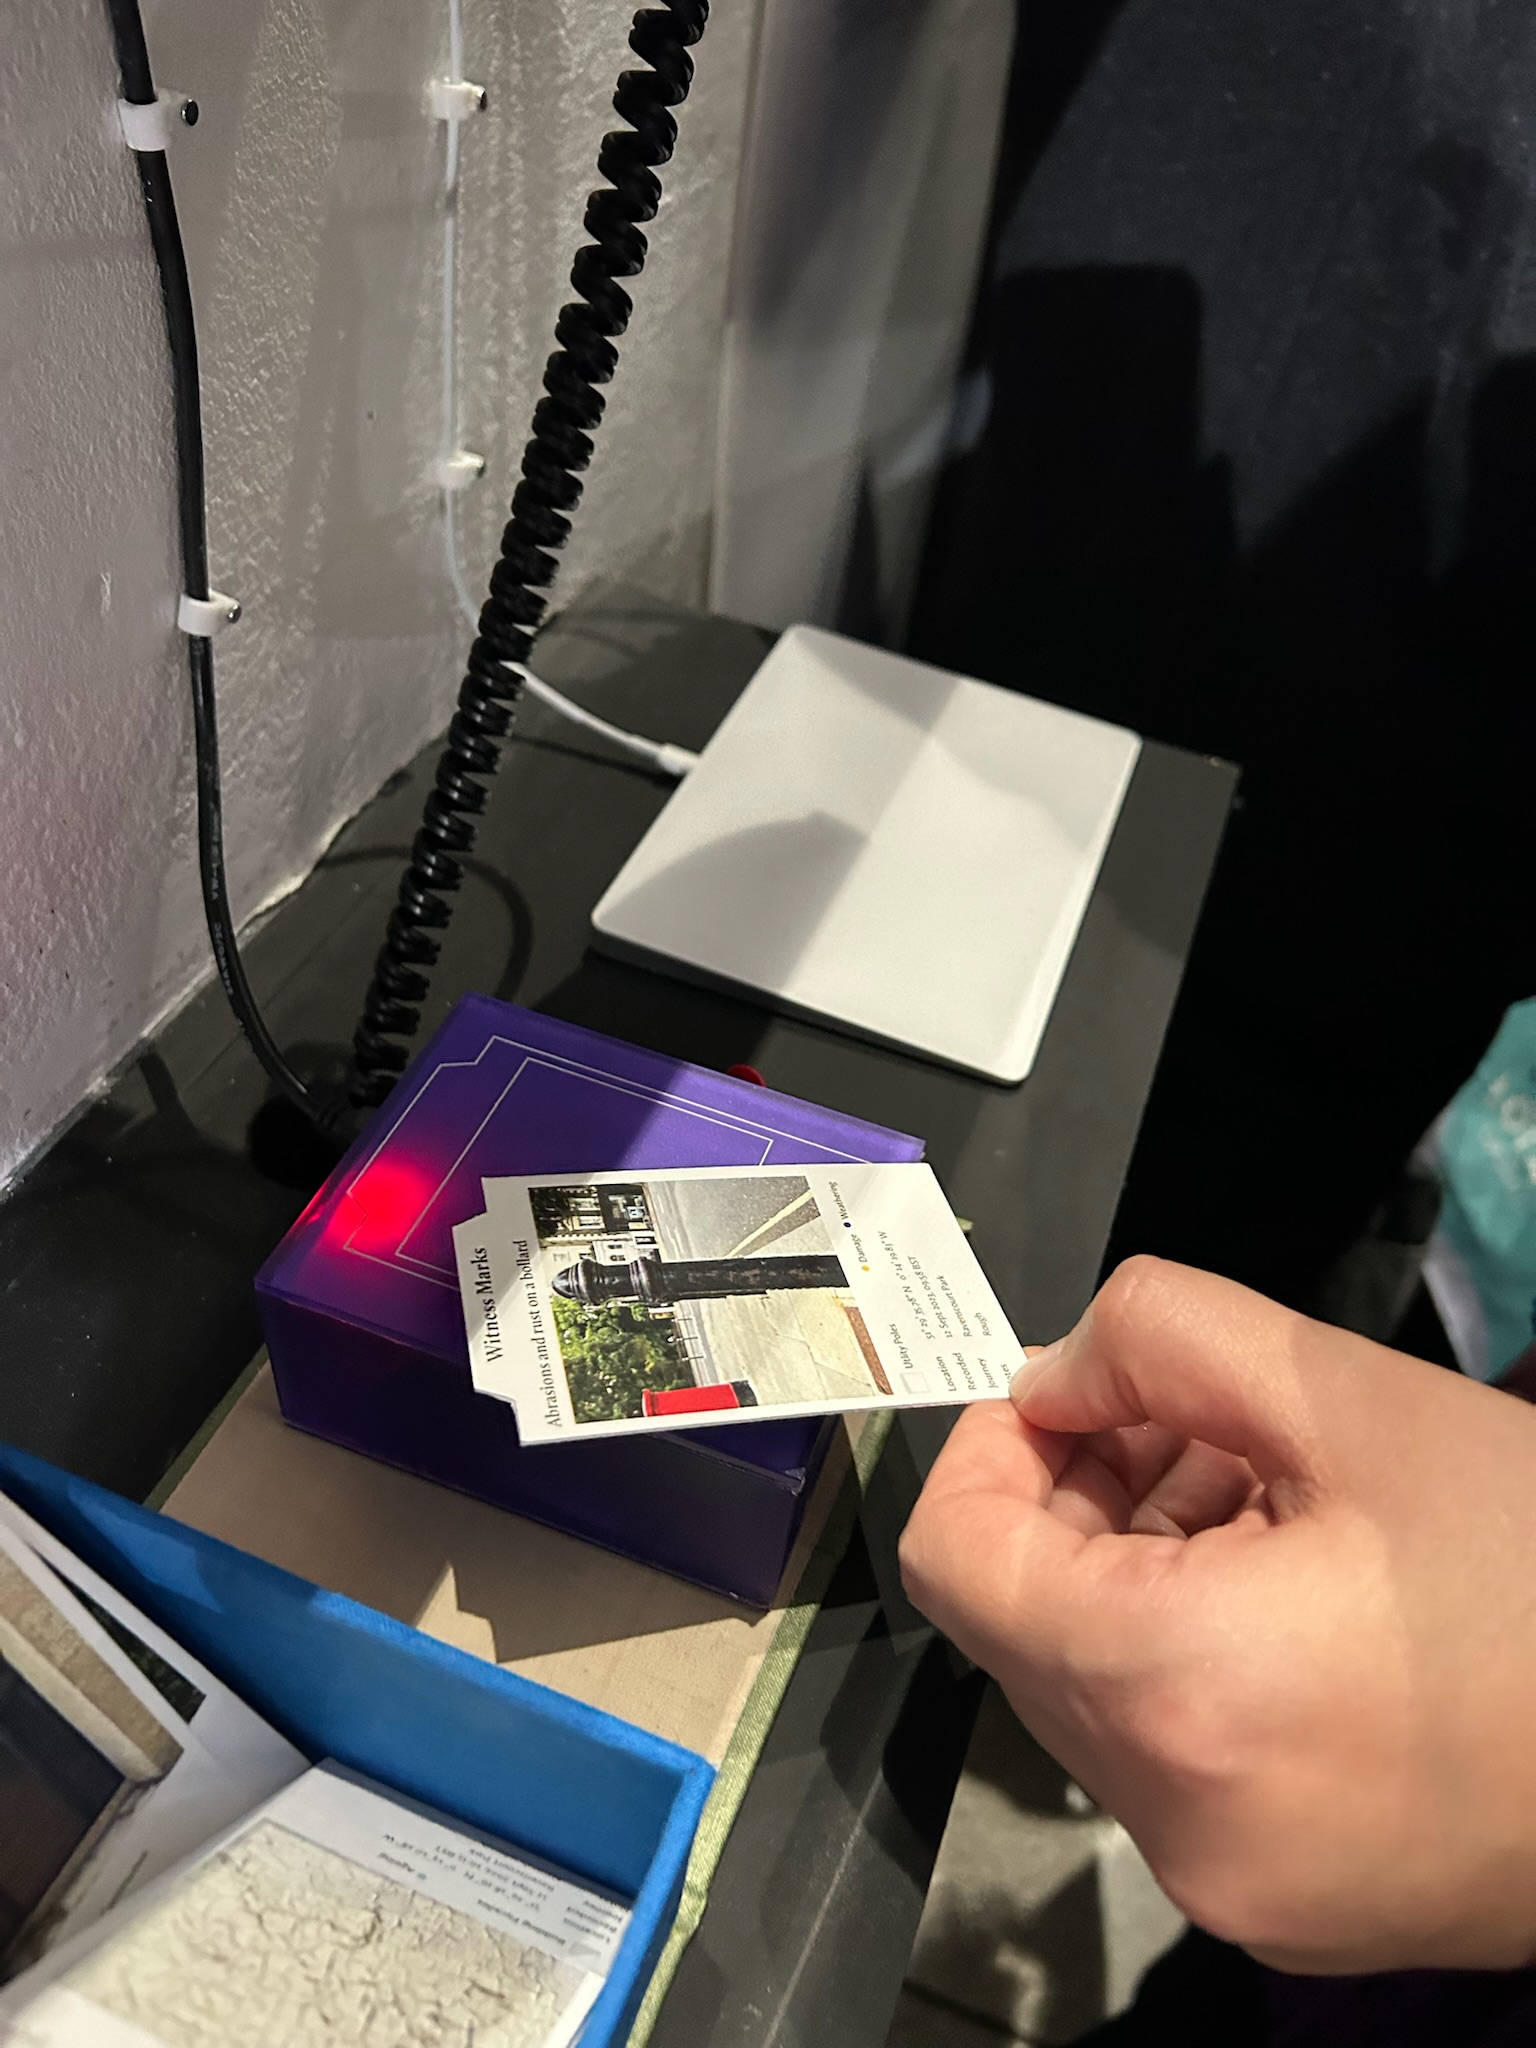
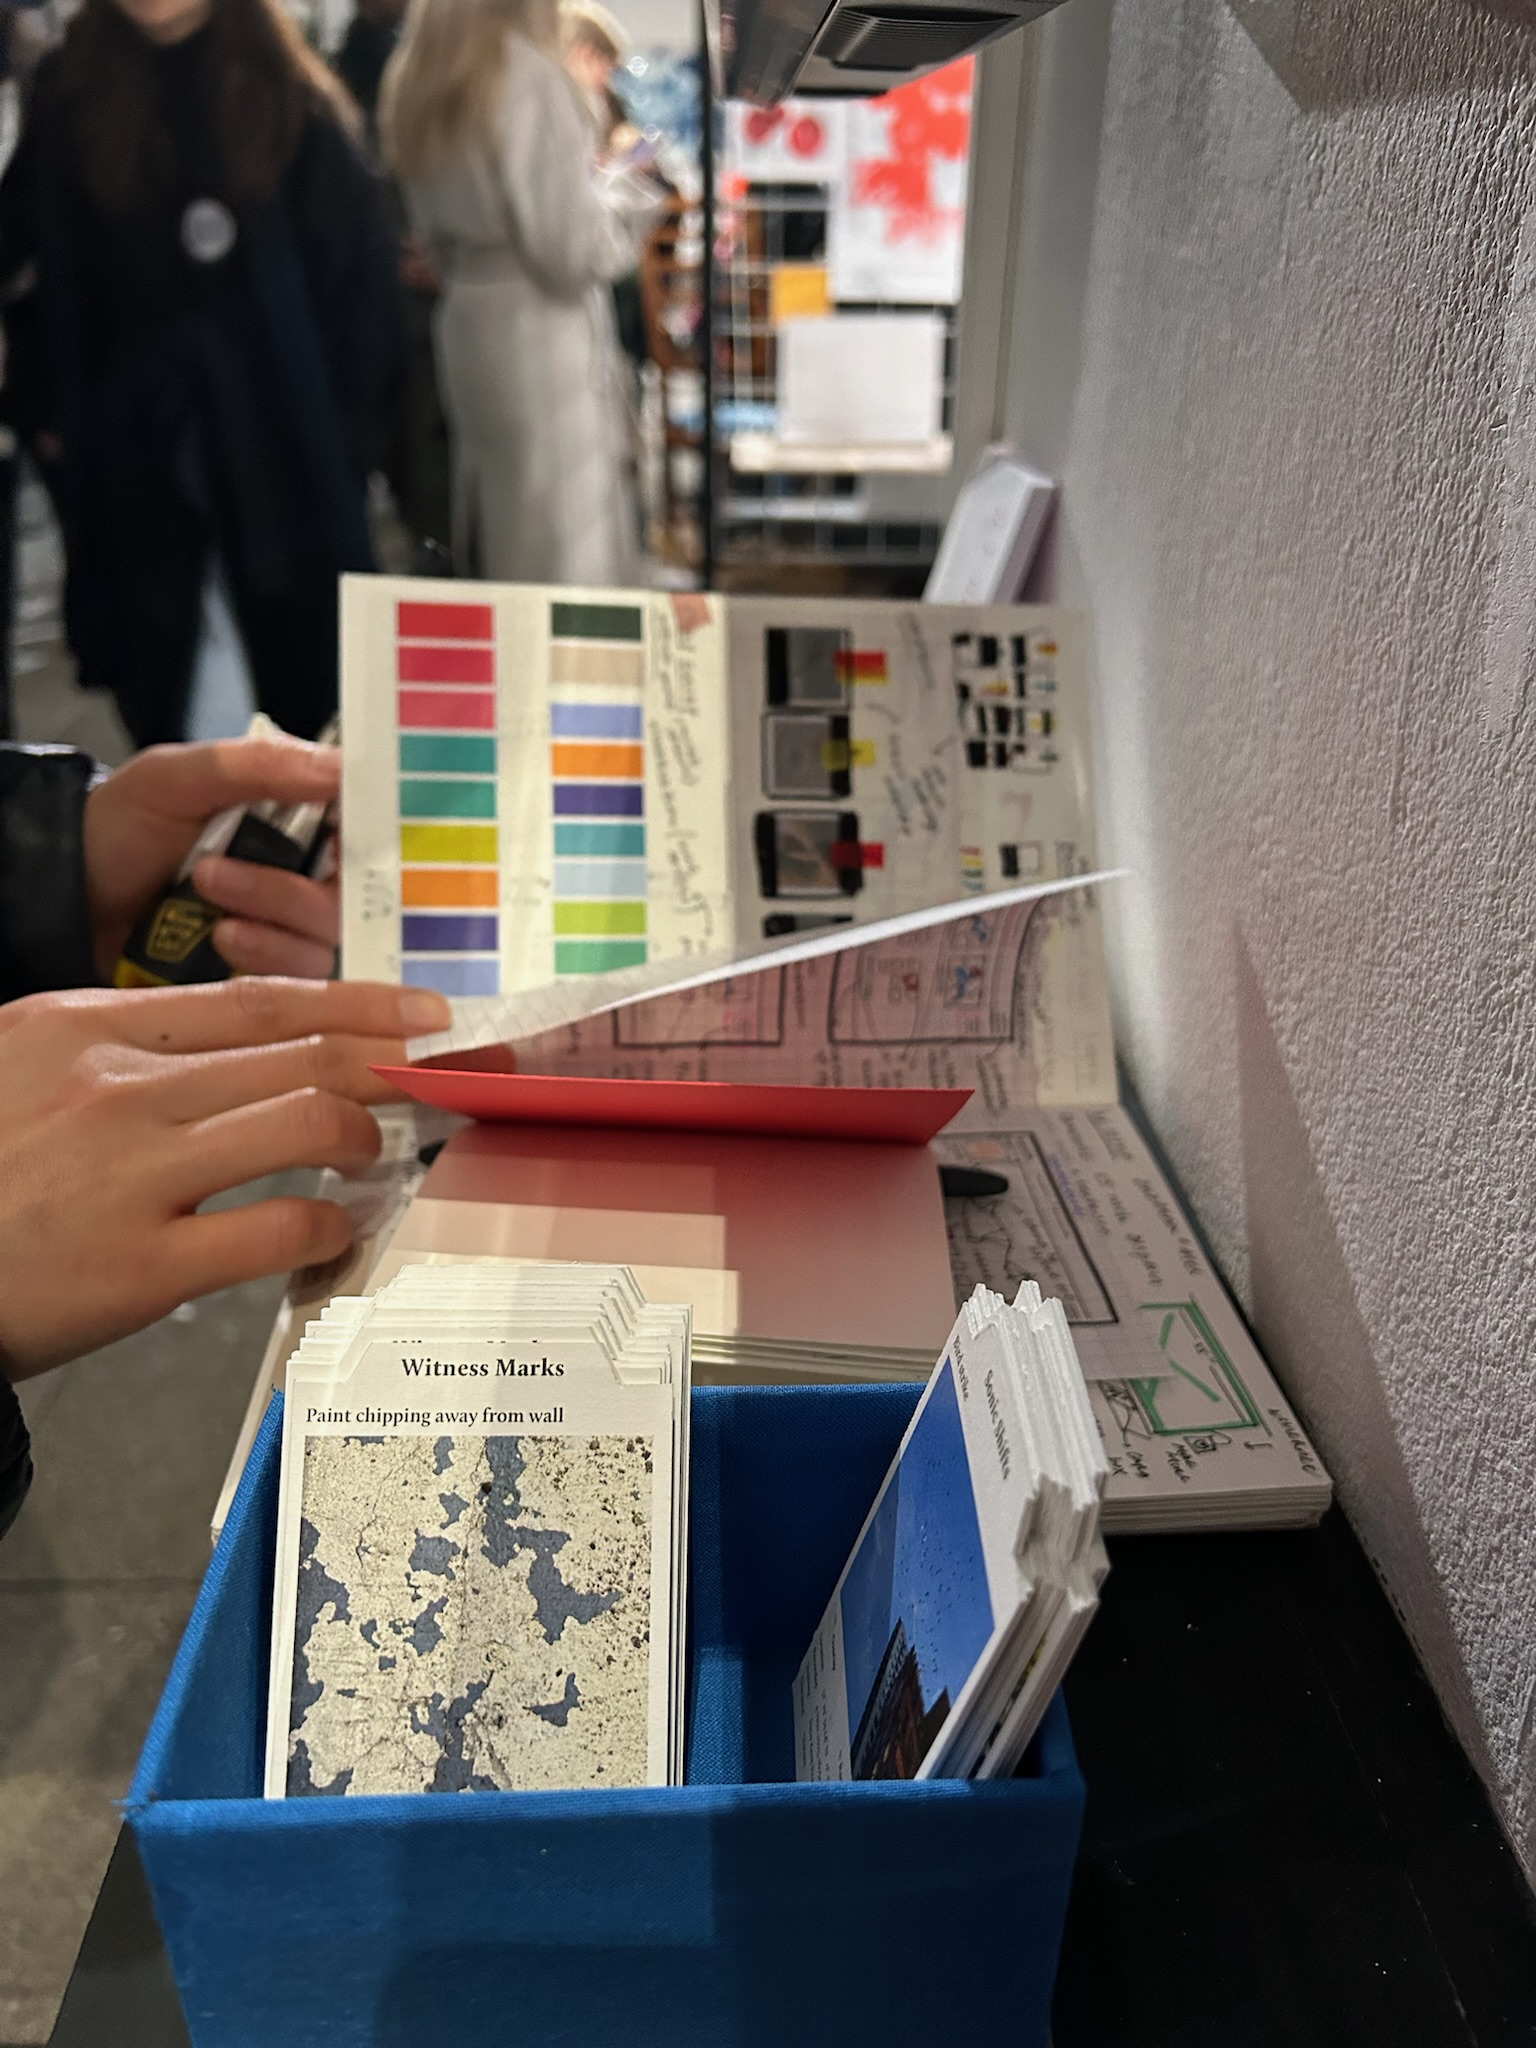
Witness Marks
Observations that highlight the diverse range of wear and tear, as well as marks, hidden within a cityscape. These marks and signs collectively create the unique fabric of a city, often telling stories about the passage of time and serving as witnesses to the interactions between human activity, nature, and the built environment.
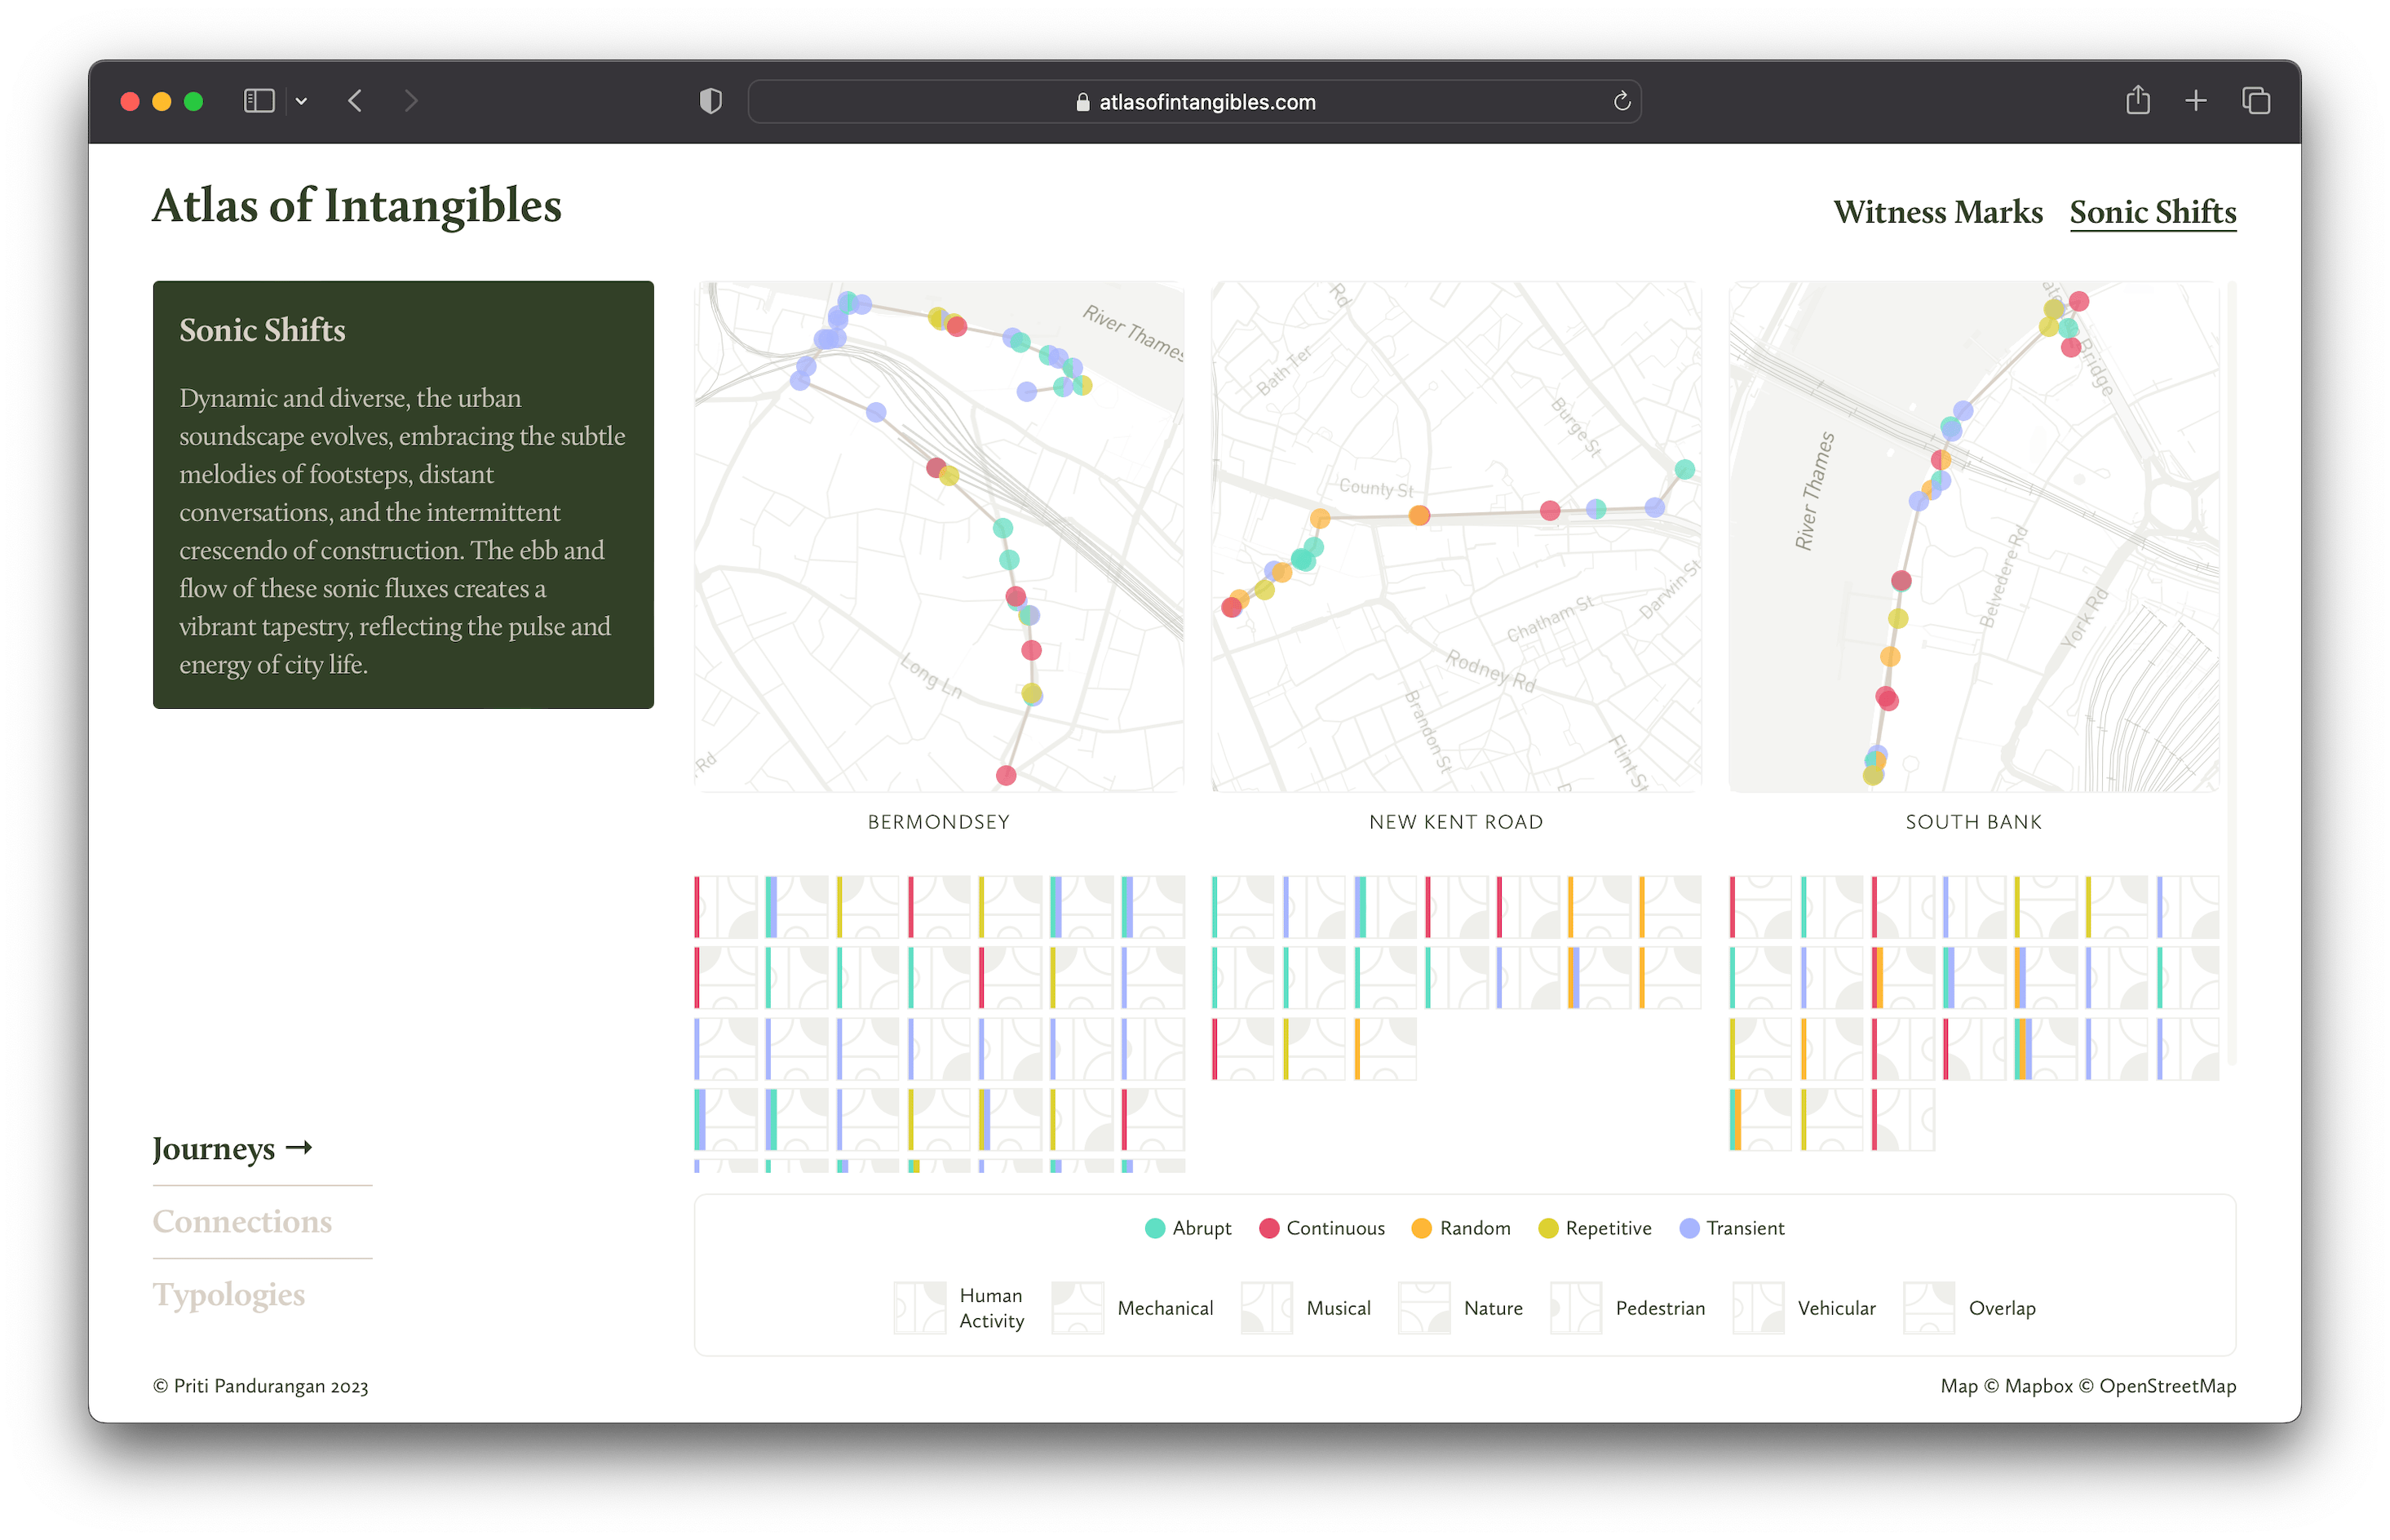
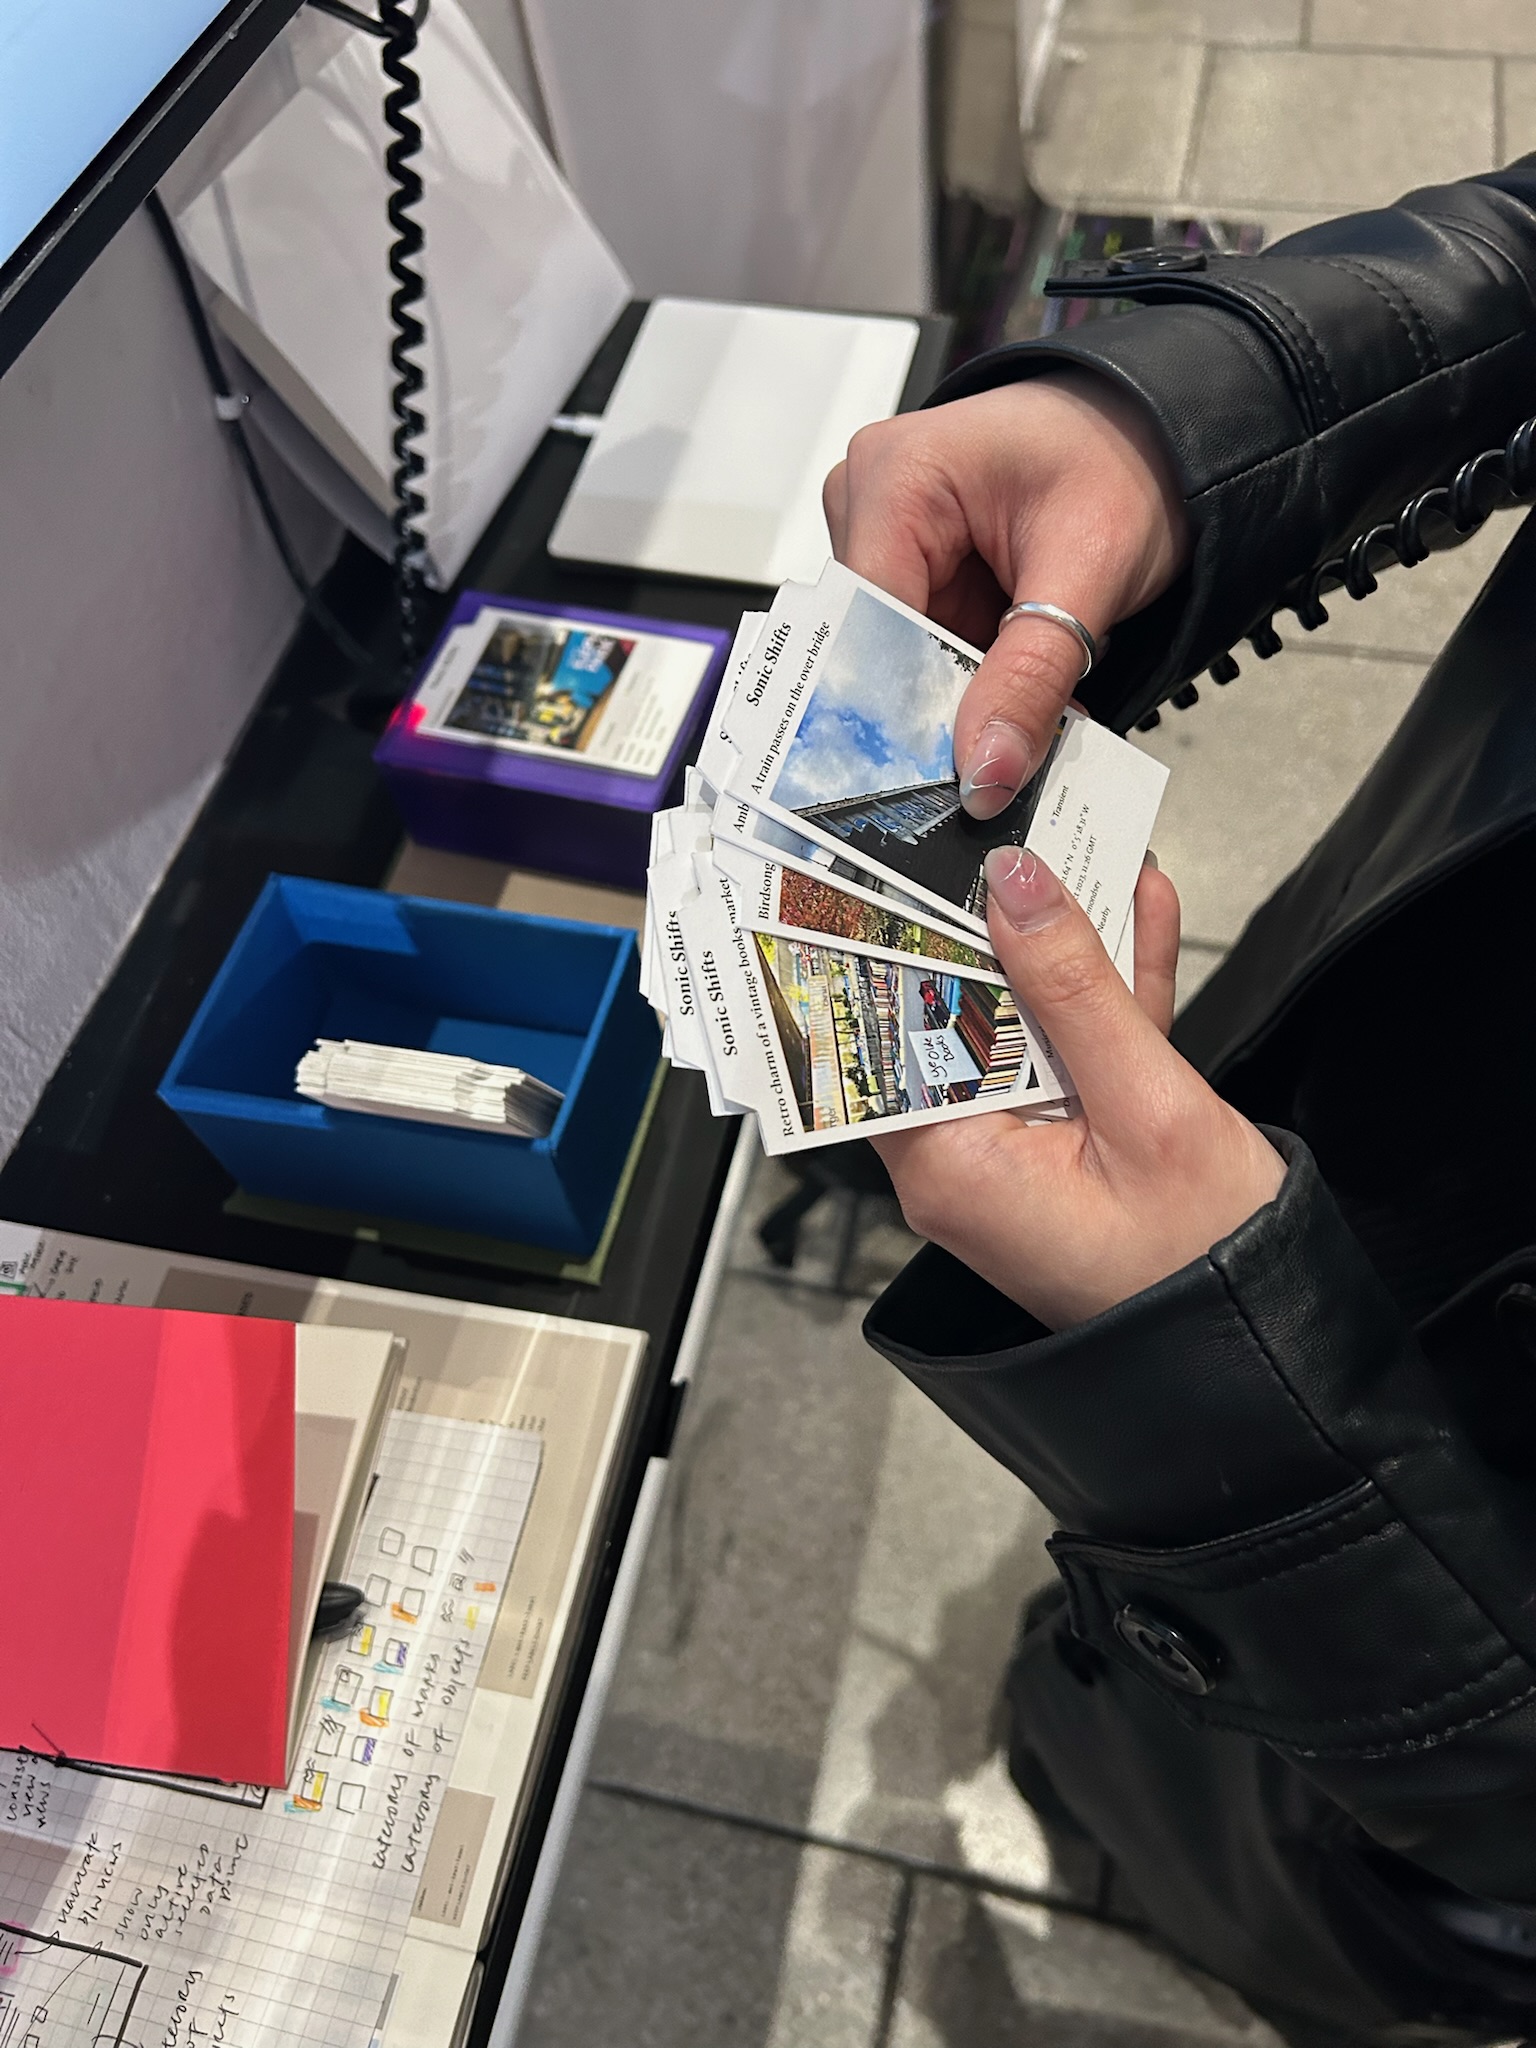
Sonic Shifts
Dynamic and diverse, the urban soundscape evolves, embracing the subtle melodies of footsteps, distant conversations, and the intermittent crescendo of construction. The ebb and flow of these sonic fluxes creates a vibrant tapestry, reflecting the pulse and energy of city life.
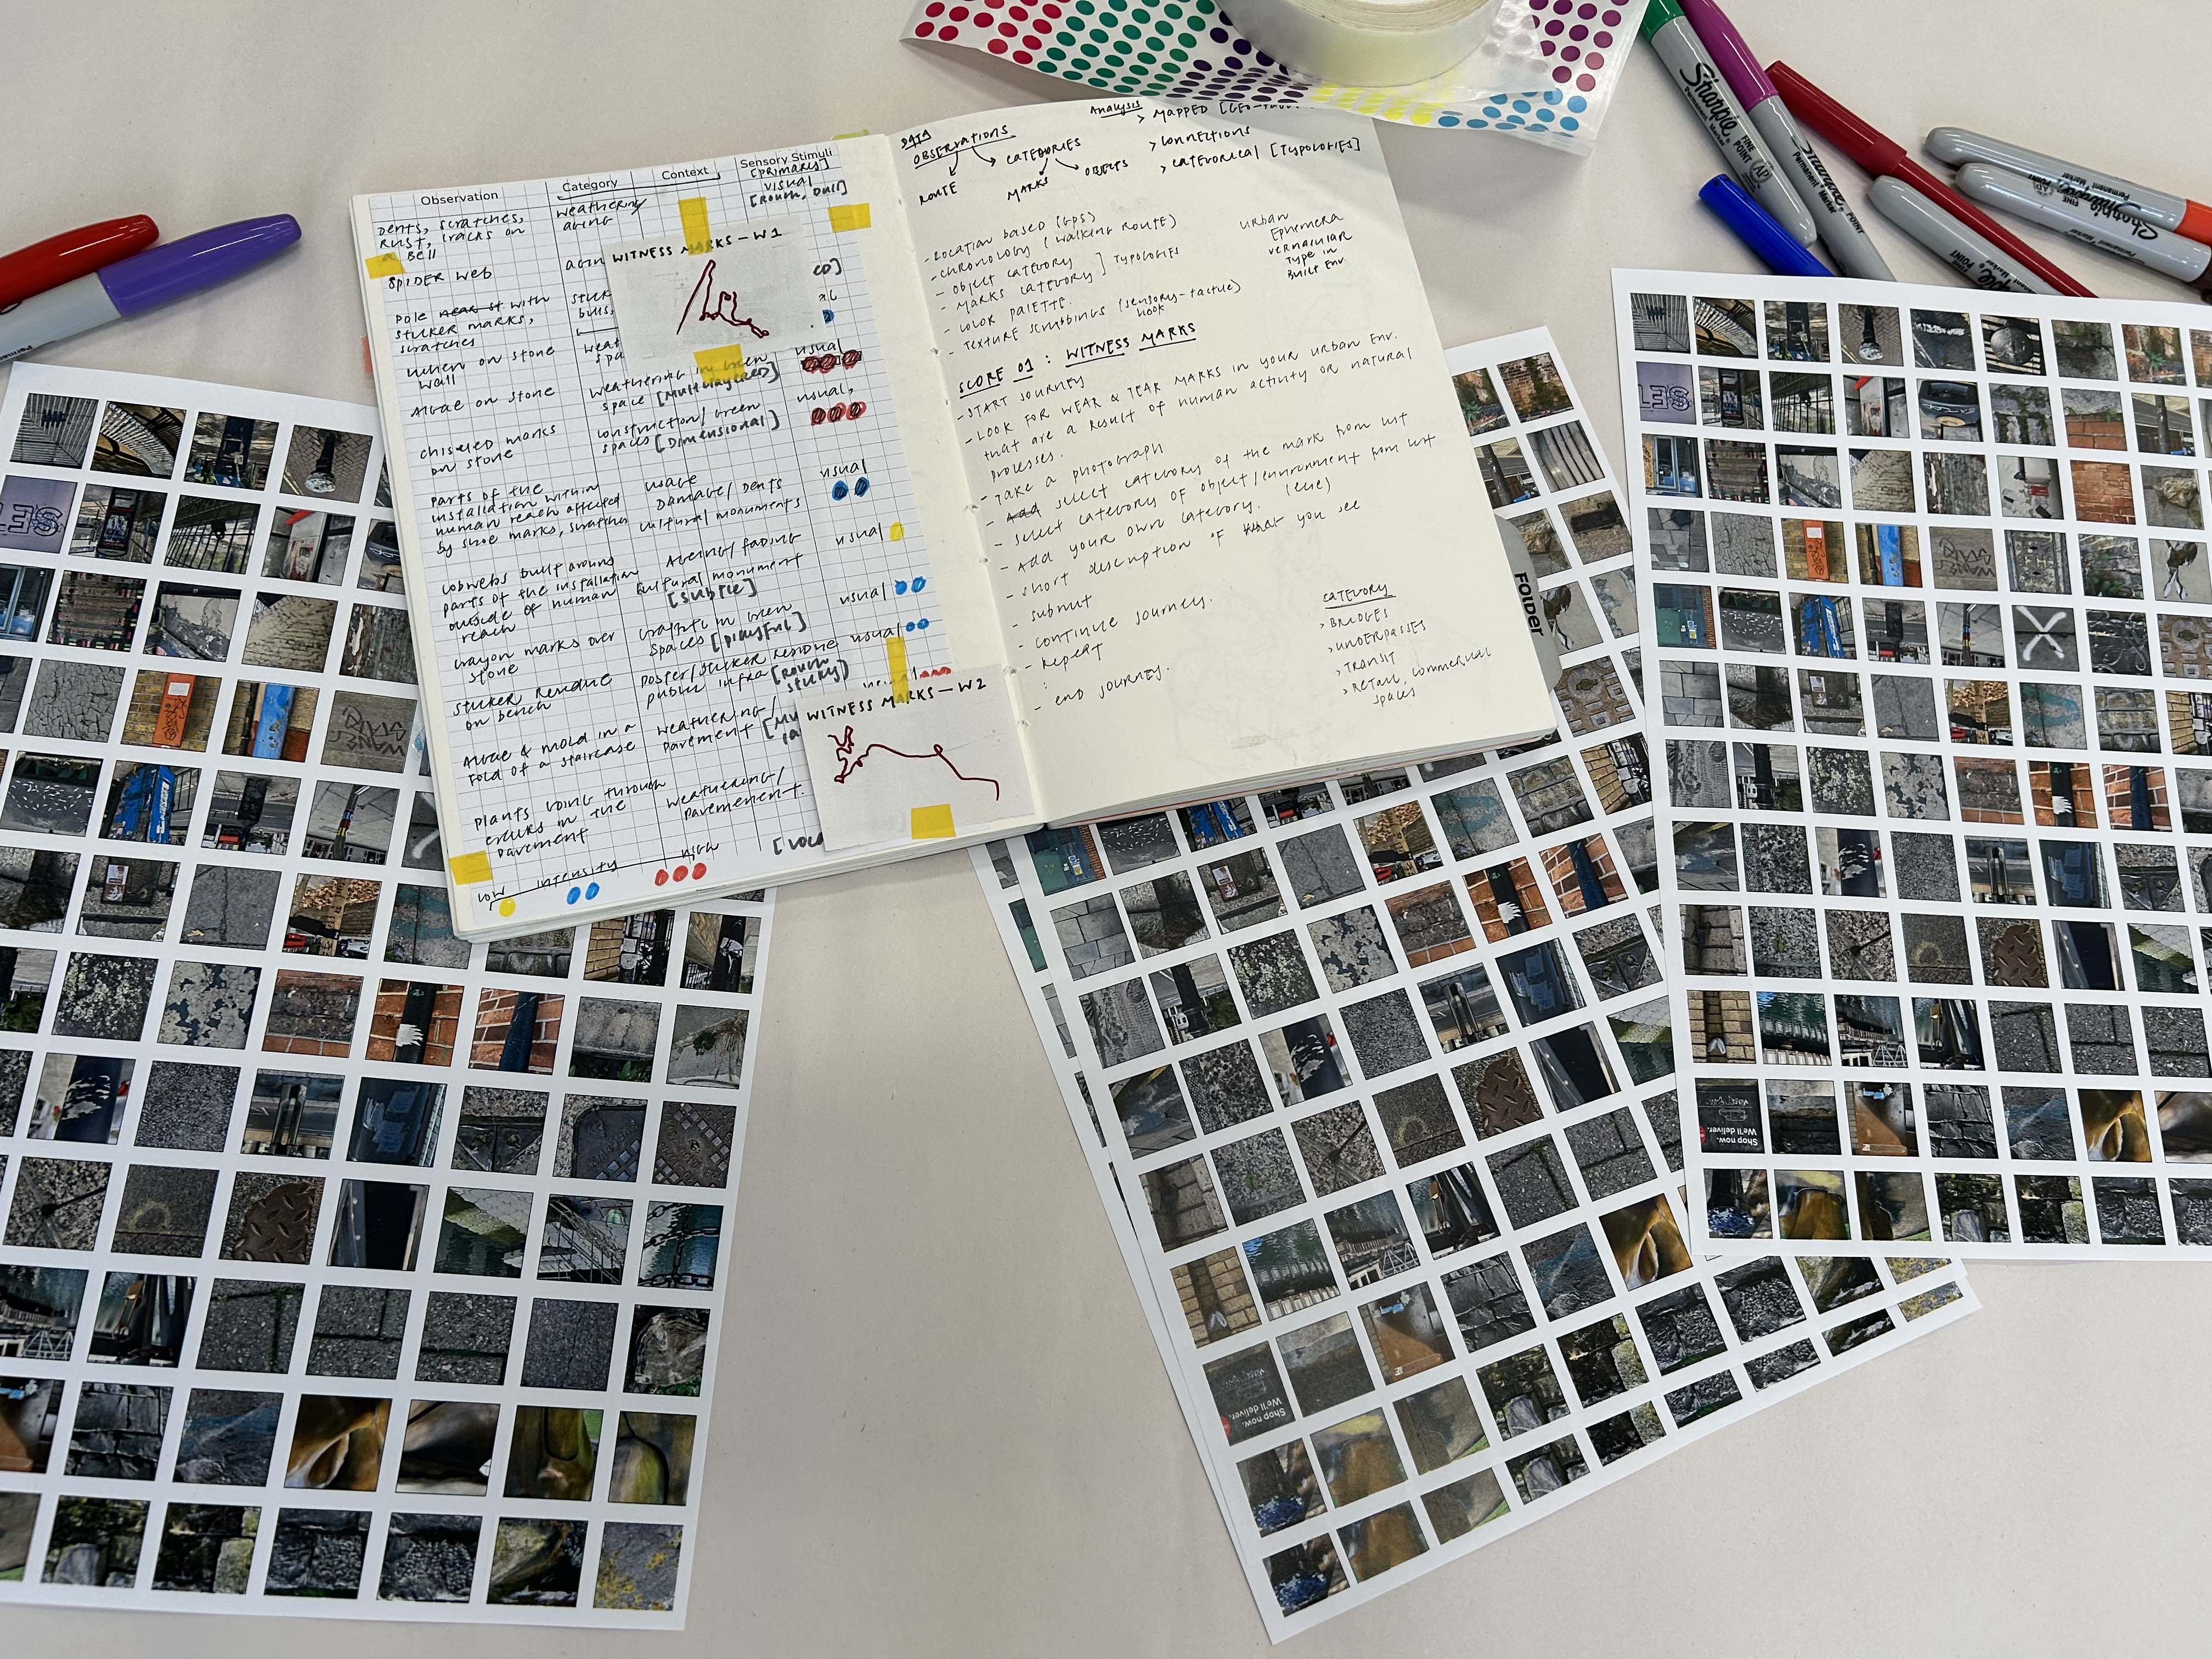
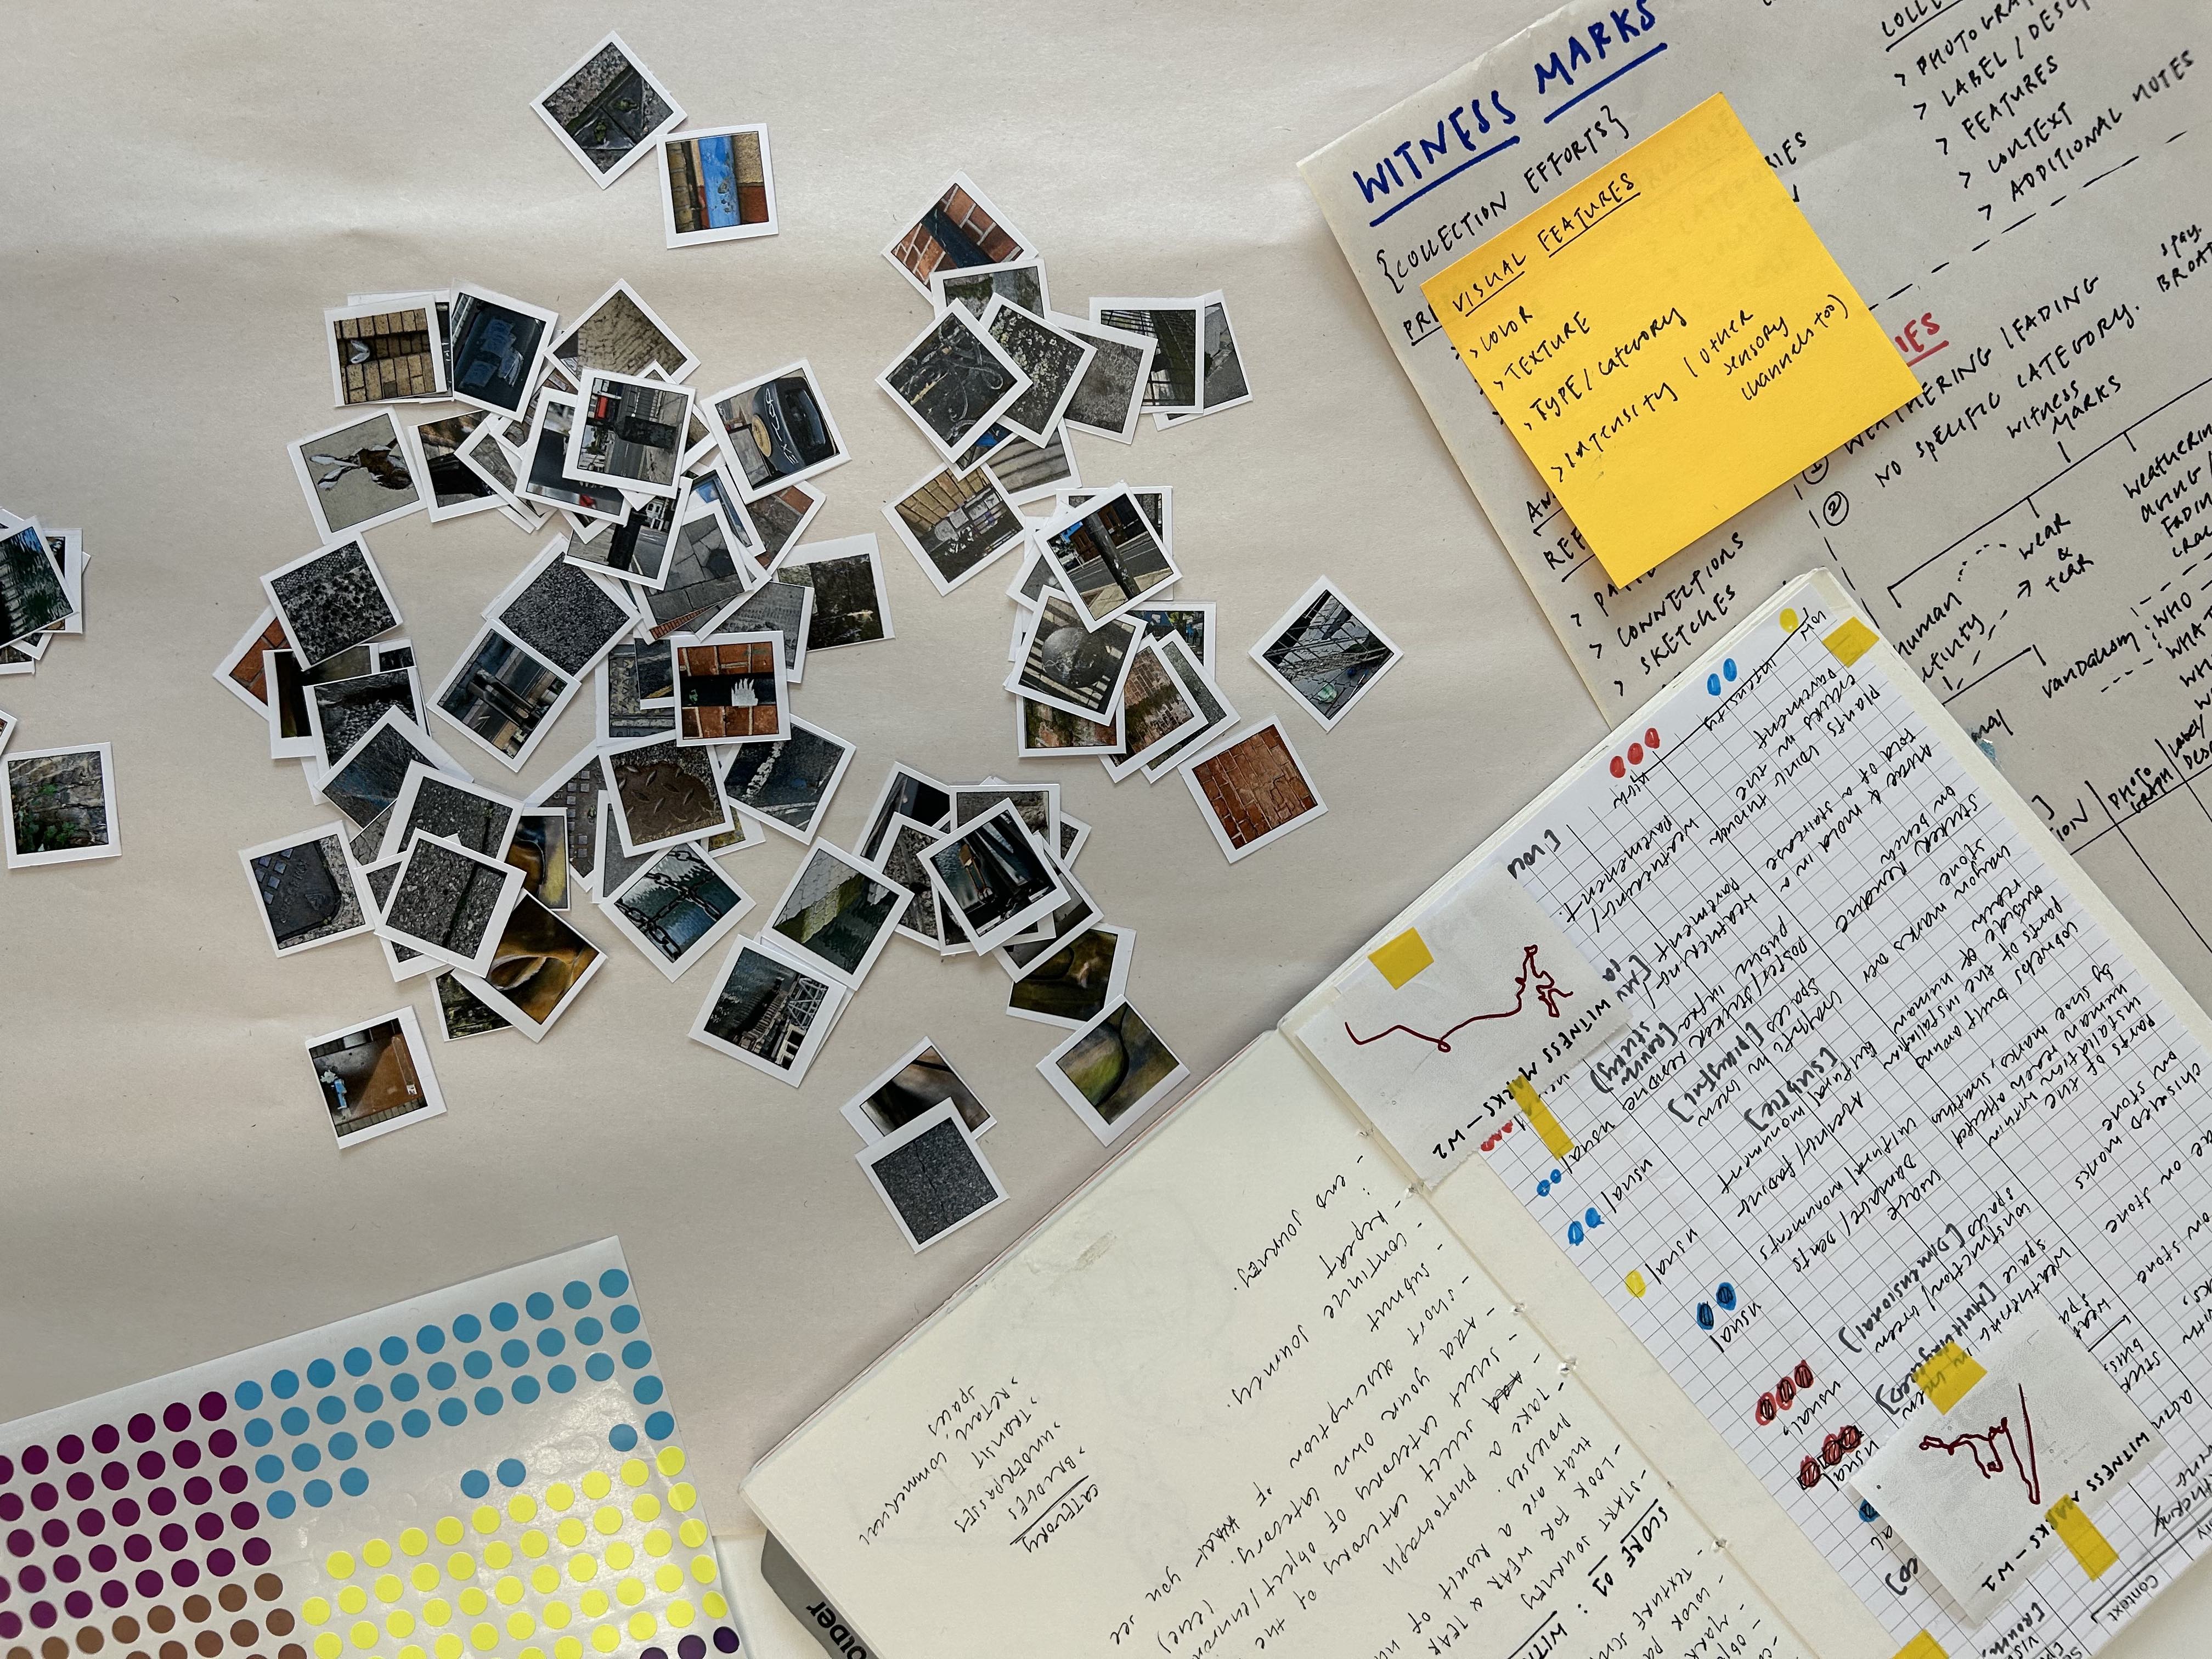
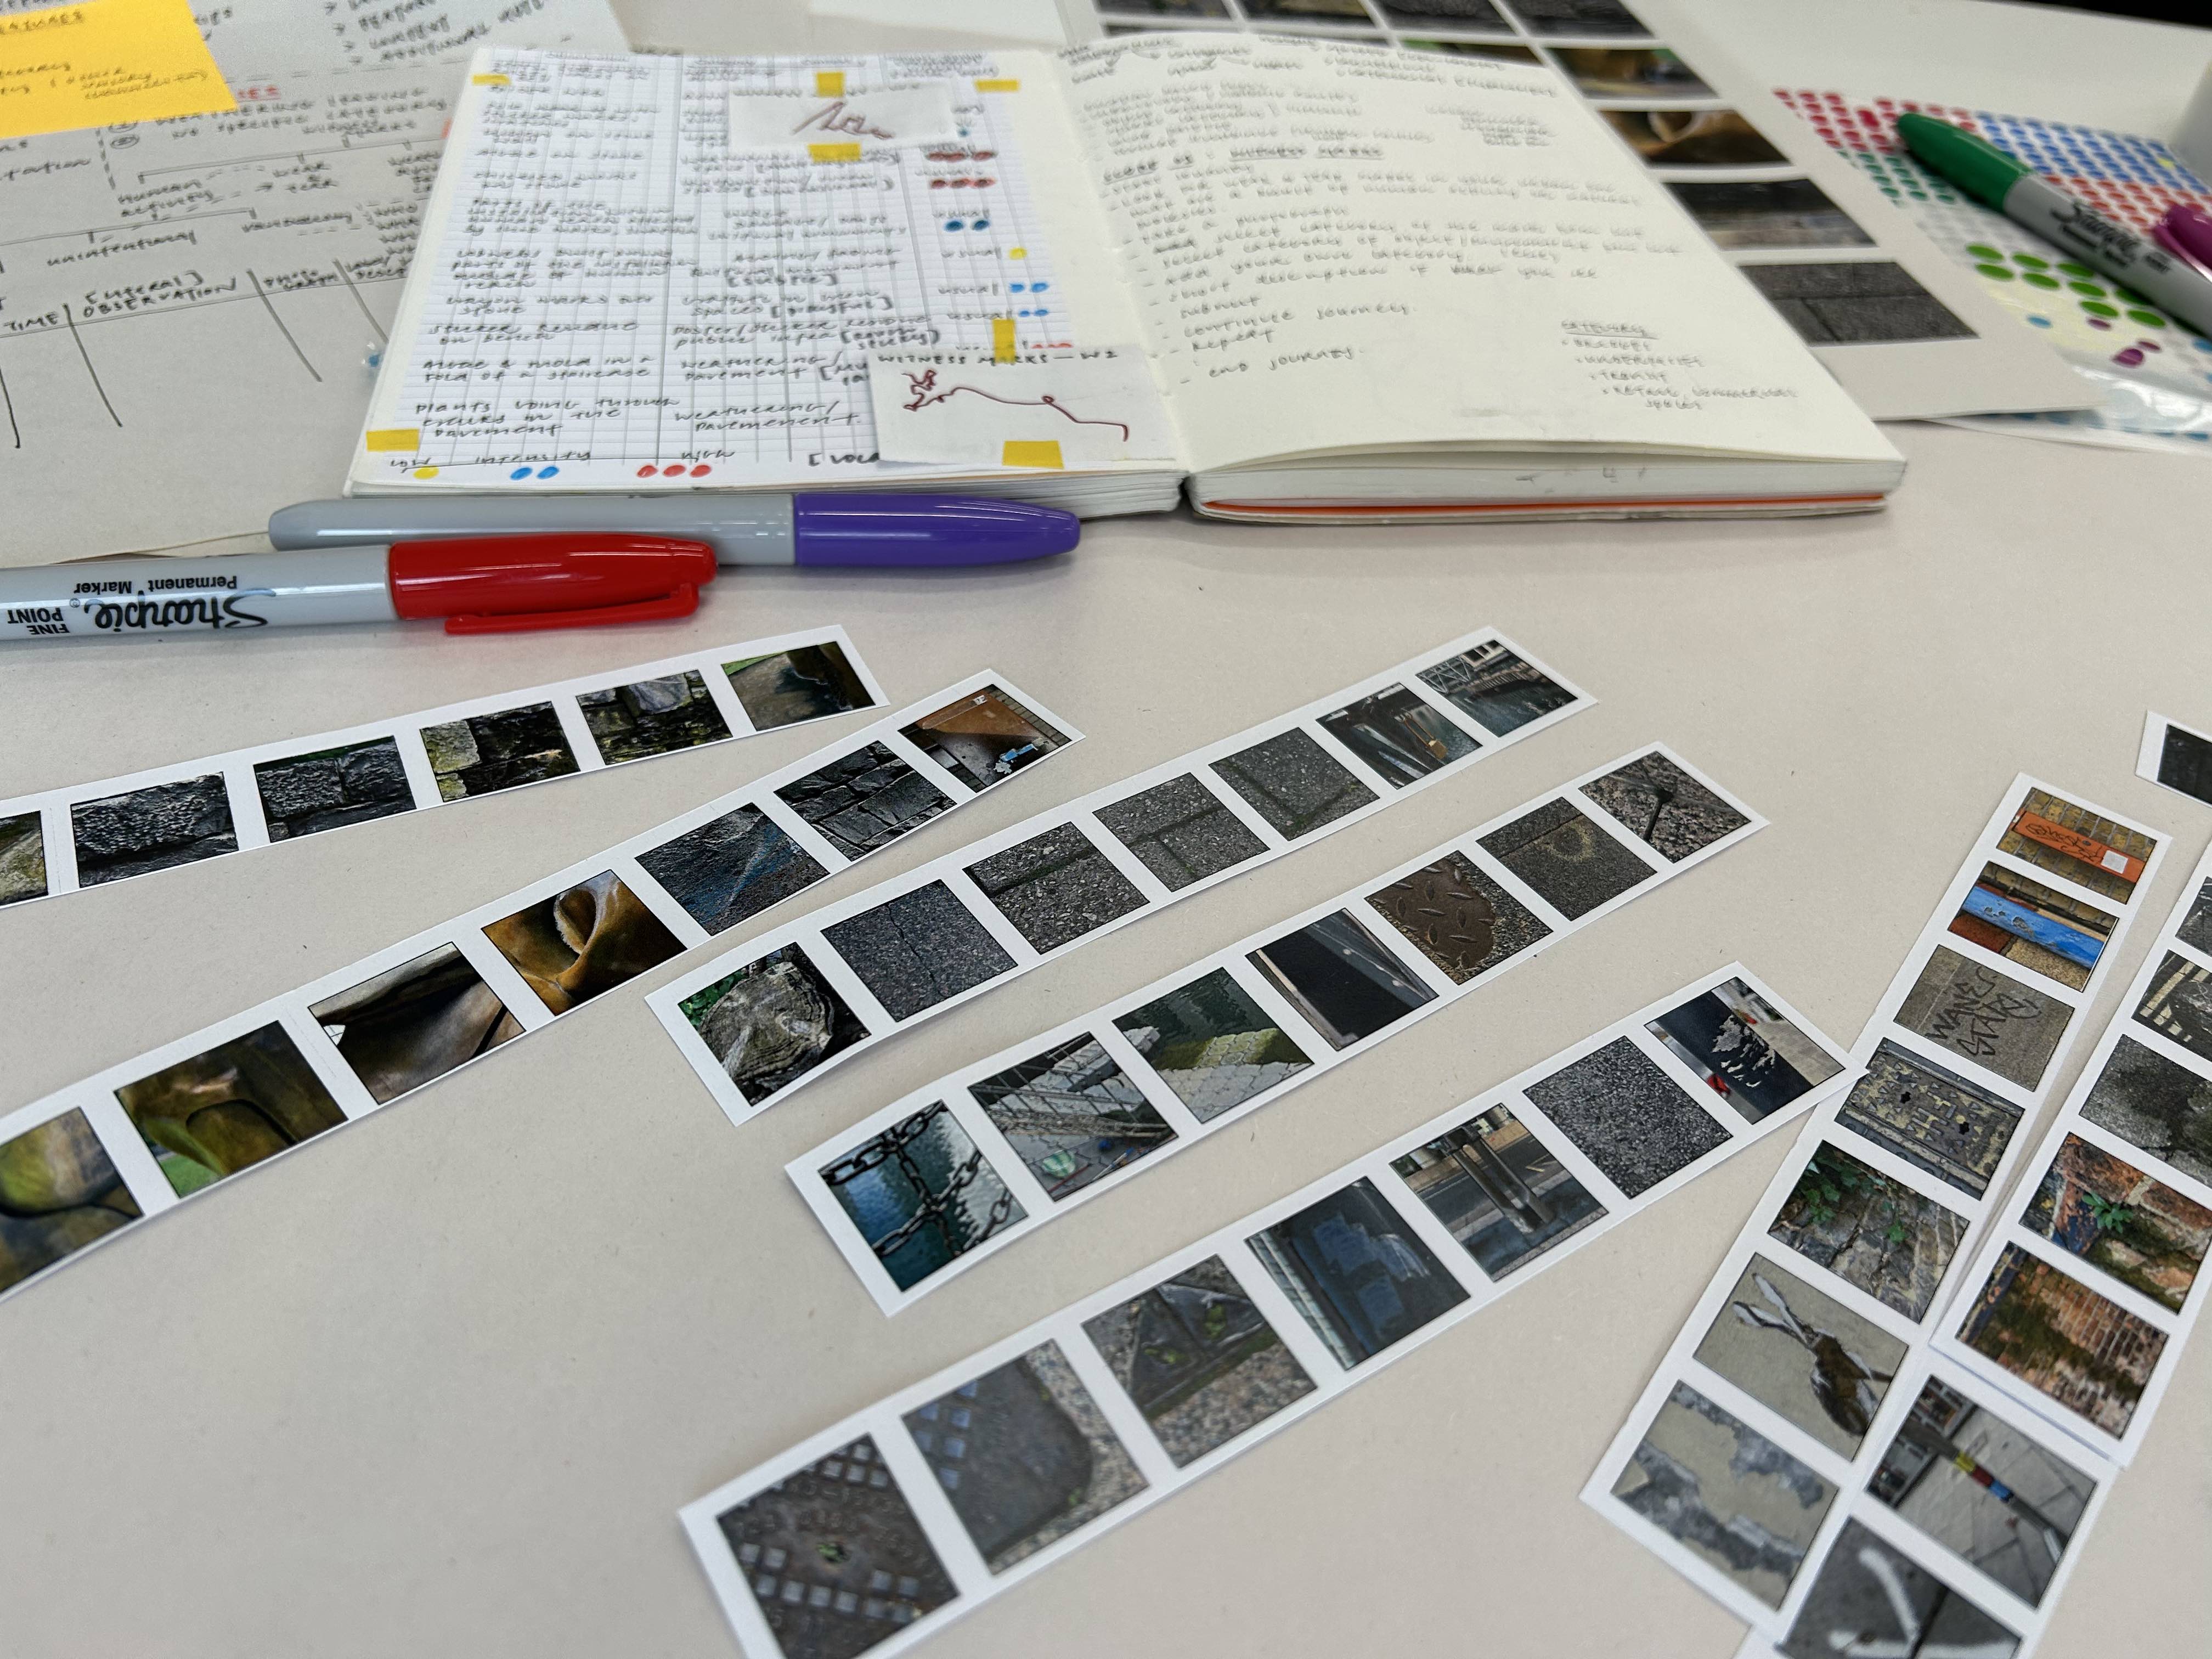
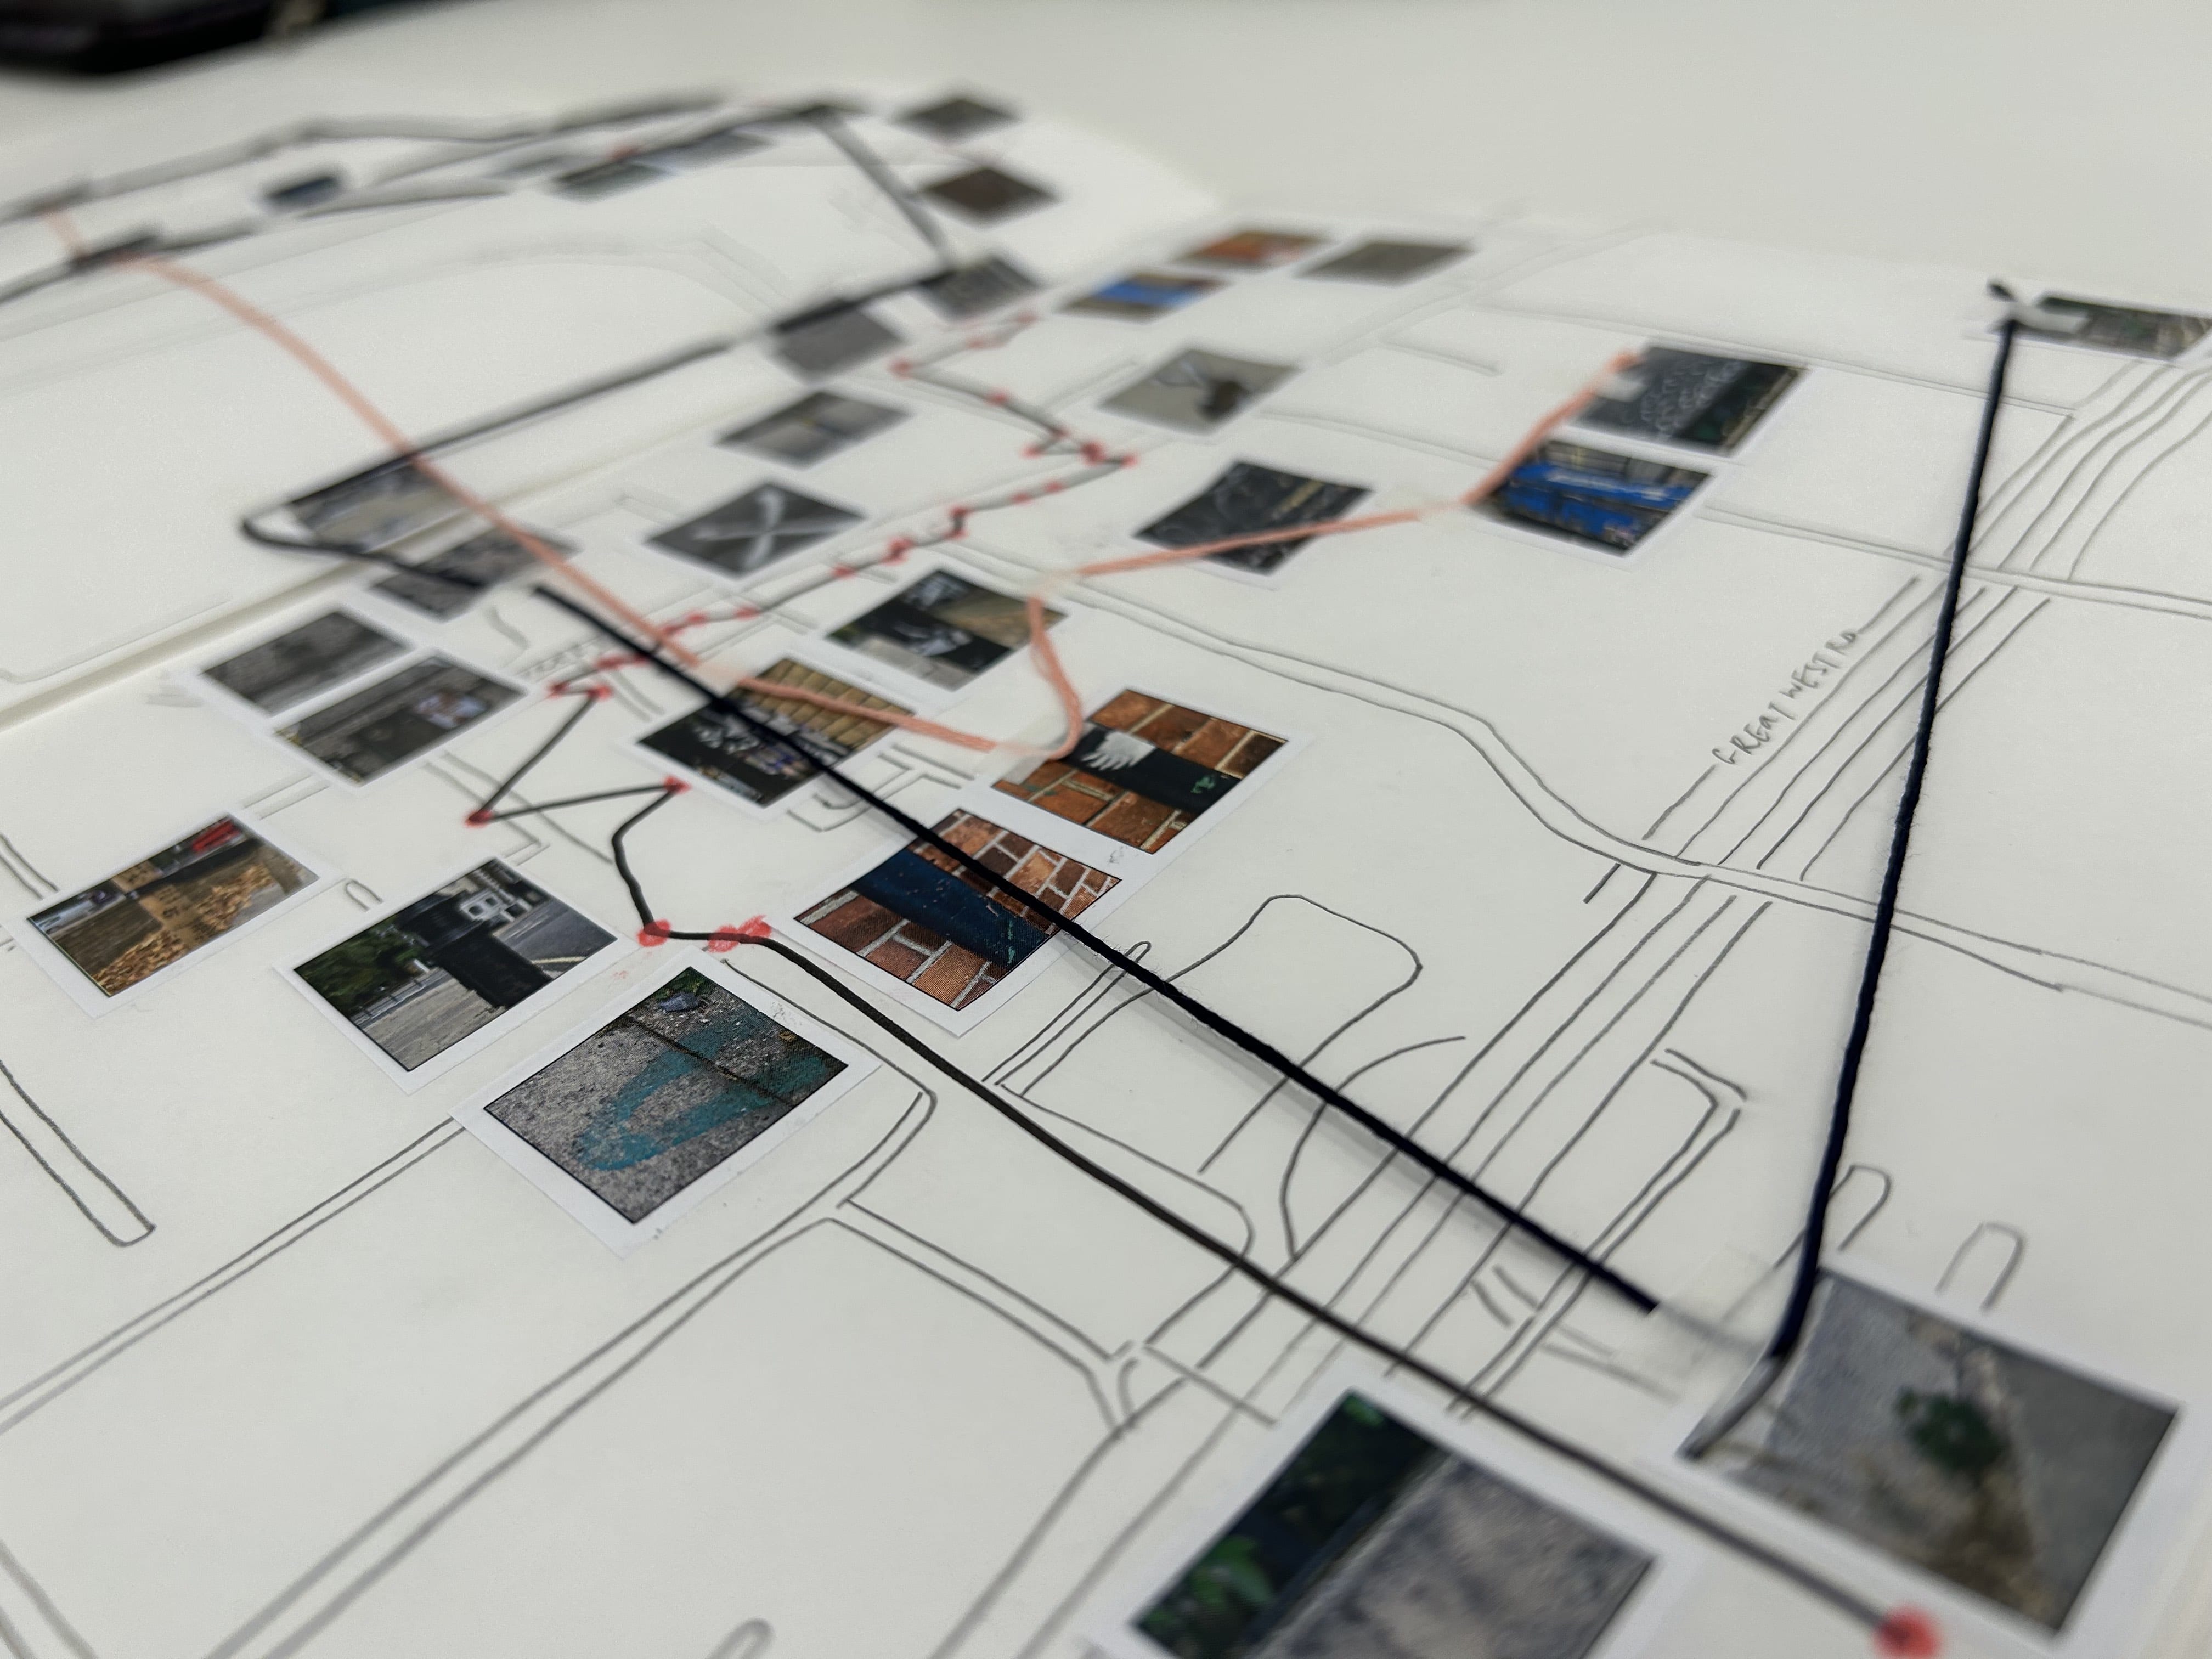
Visual Analysis
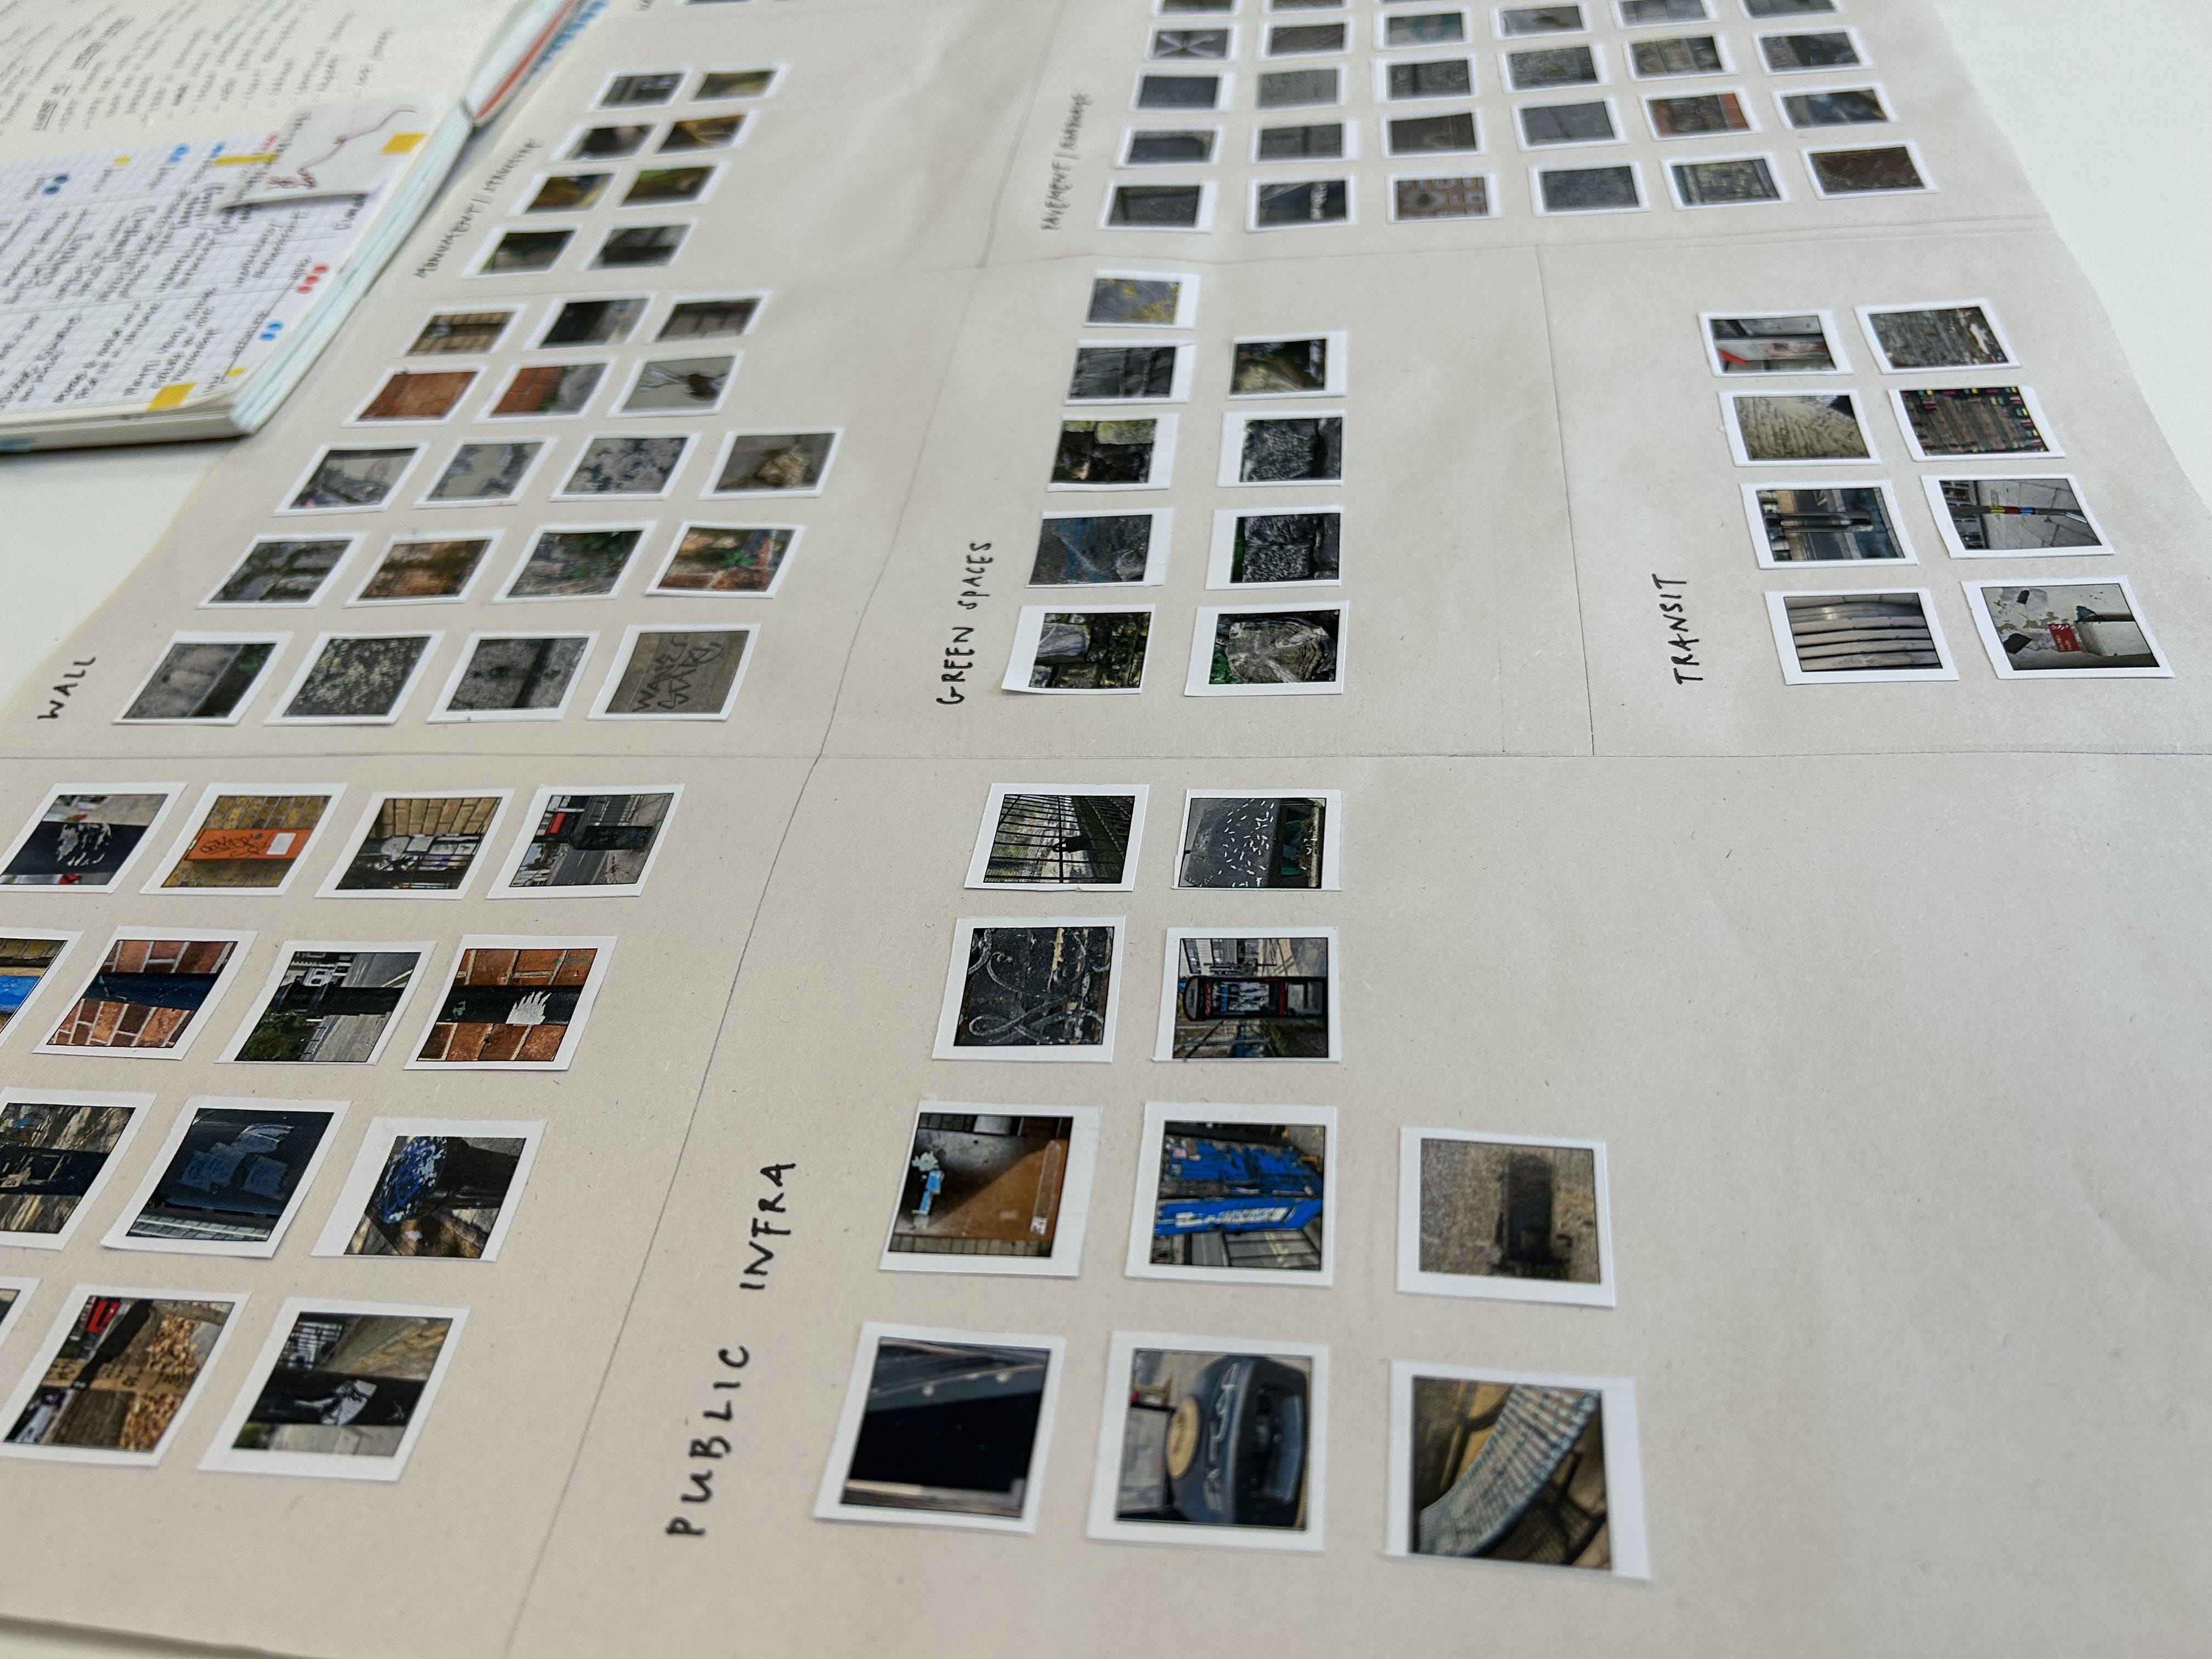
Following the collection of score-based data, I began visually analysing the data to identify relationships between distinct variables. I systematically organised, categorised & compared the data in various ways to discern underlying connections and patterns. I experimented with various approaches to arrange the information, exploring different methods to potentially structure the data in the final outcome.
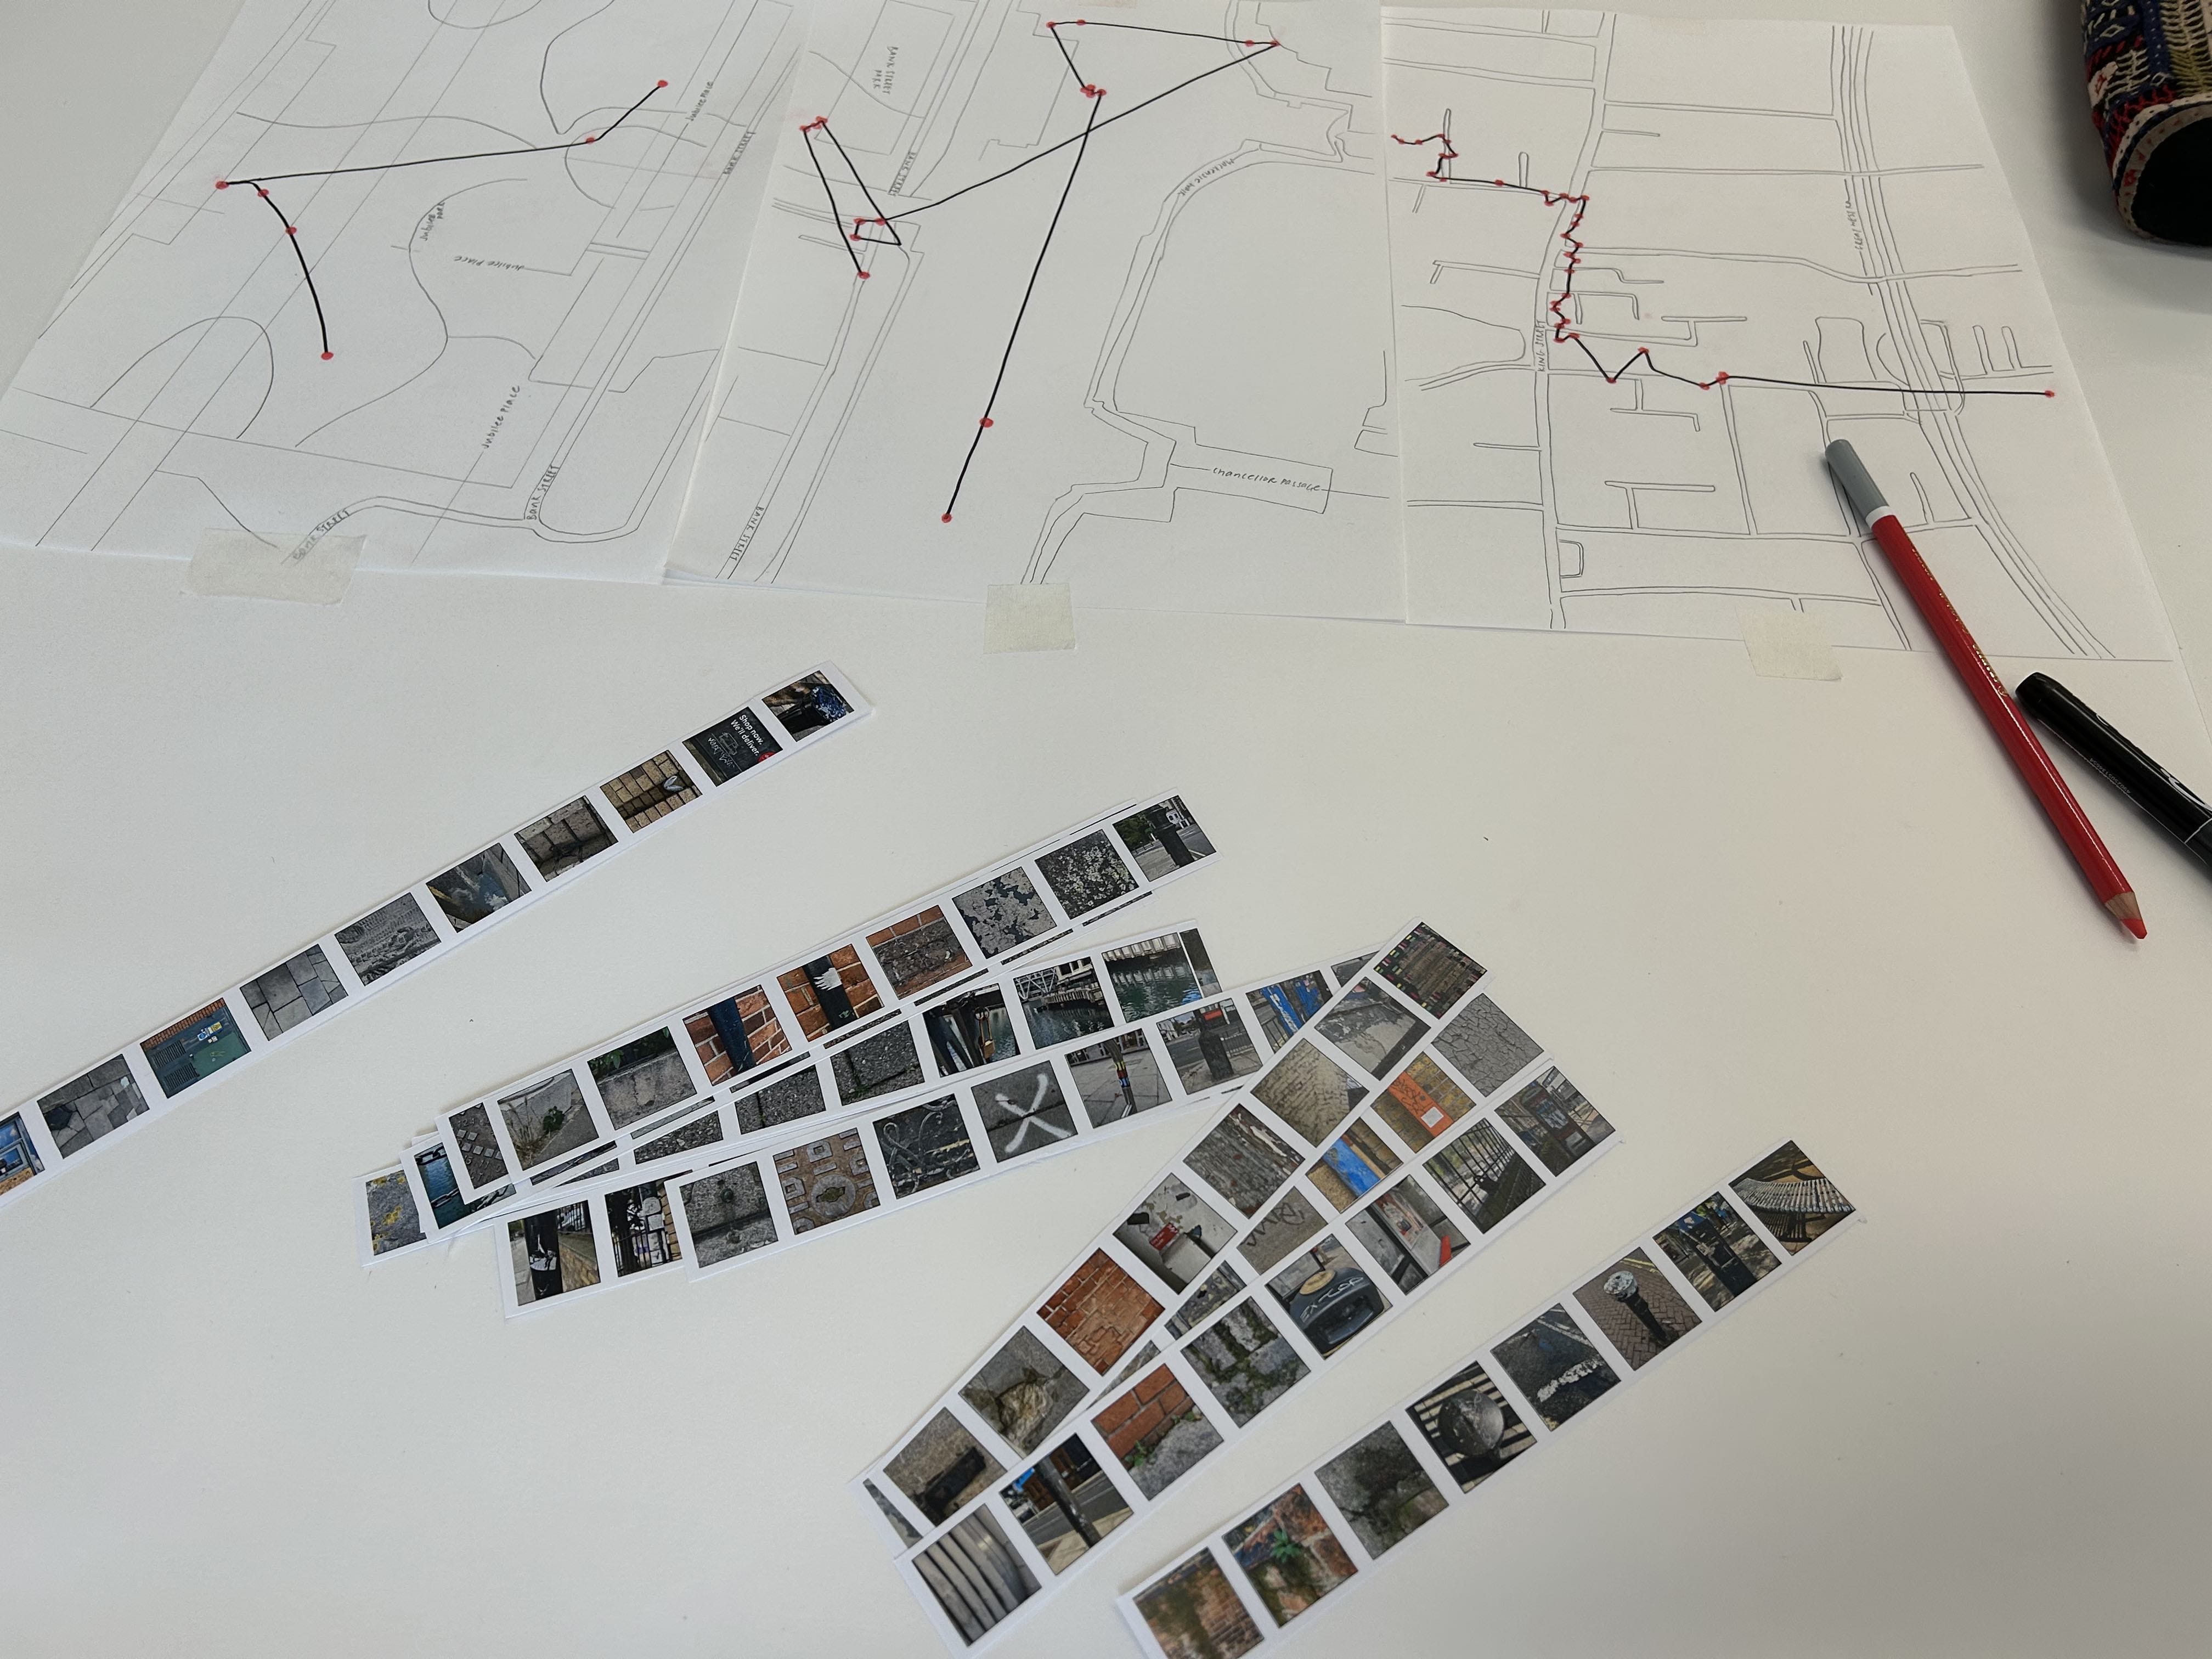
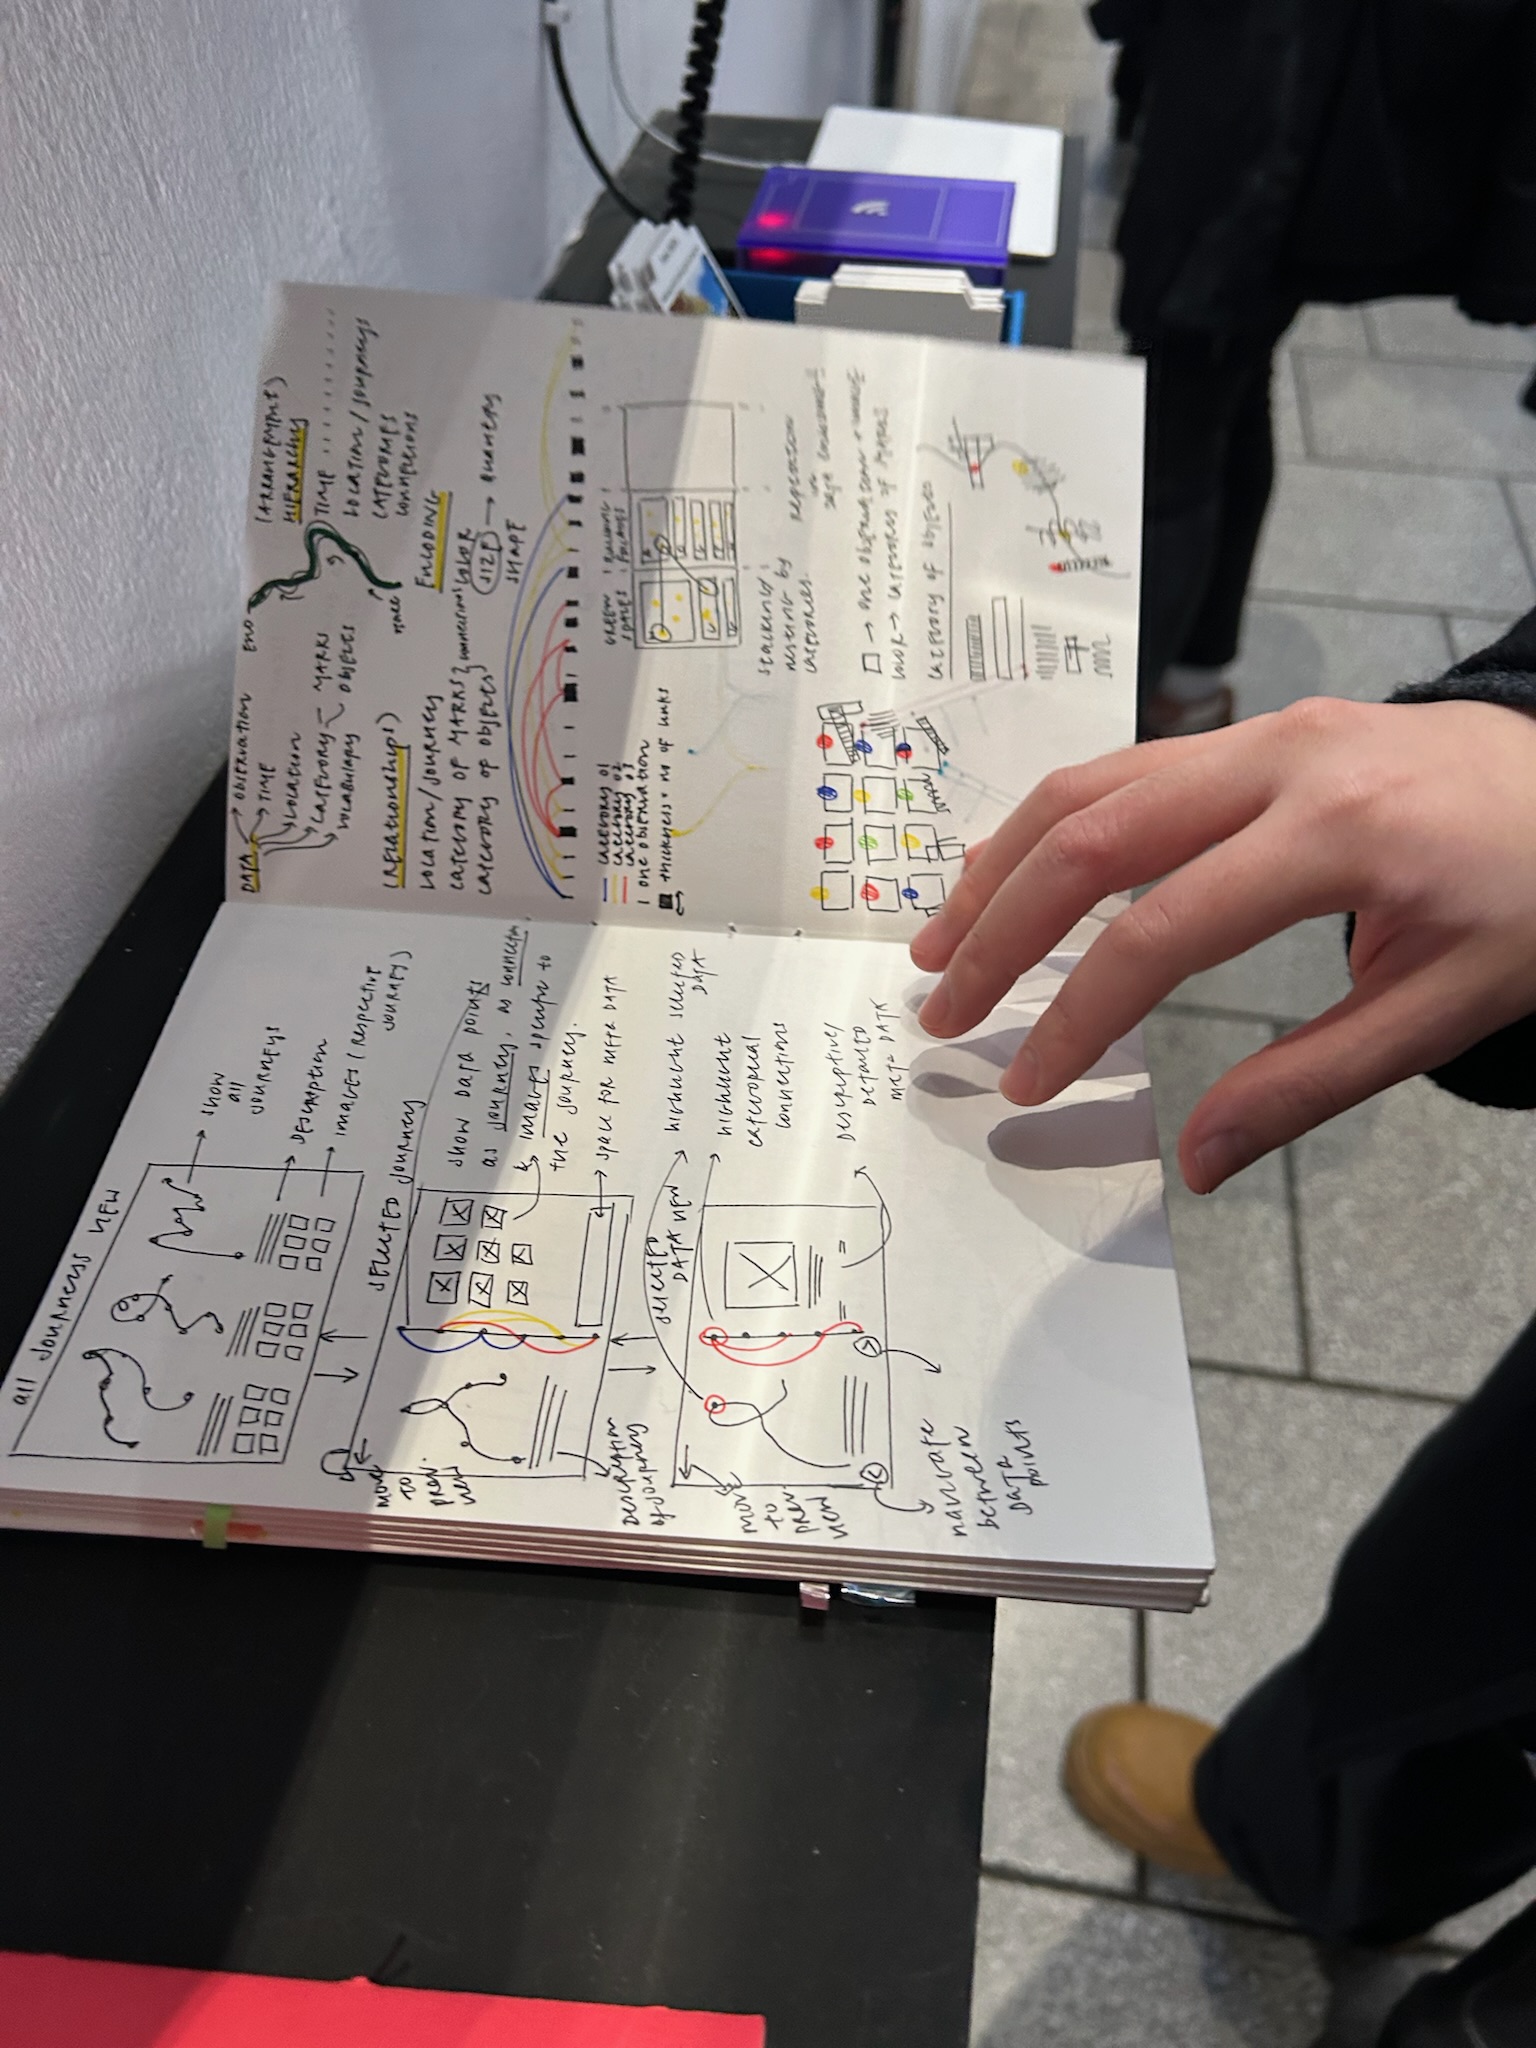
Design Direction
Through iterative cycles, I sketched out multiple visual directions, each exploring a unique perspective on how the data could be presented and interacted with. This allowed me to quickly test and discard ideas that didn’t align with the project goals, focusing on a representation that would effectively convey the relationships in the data in an engaging manner.


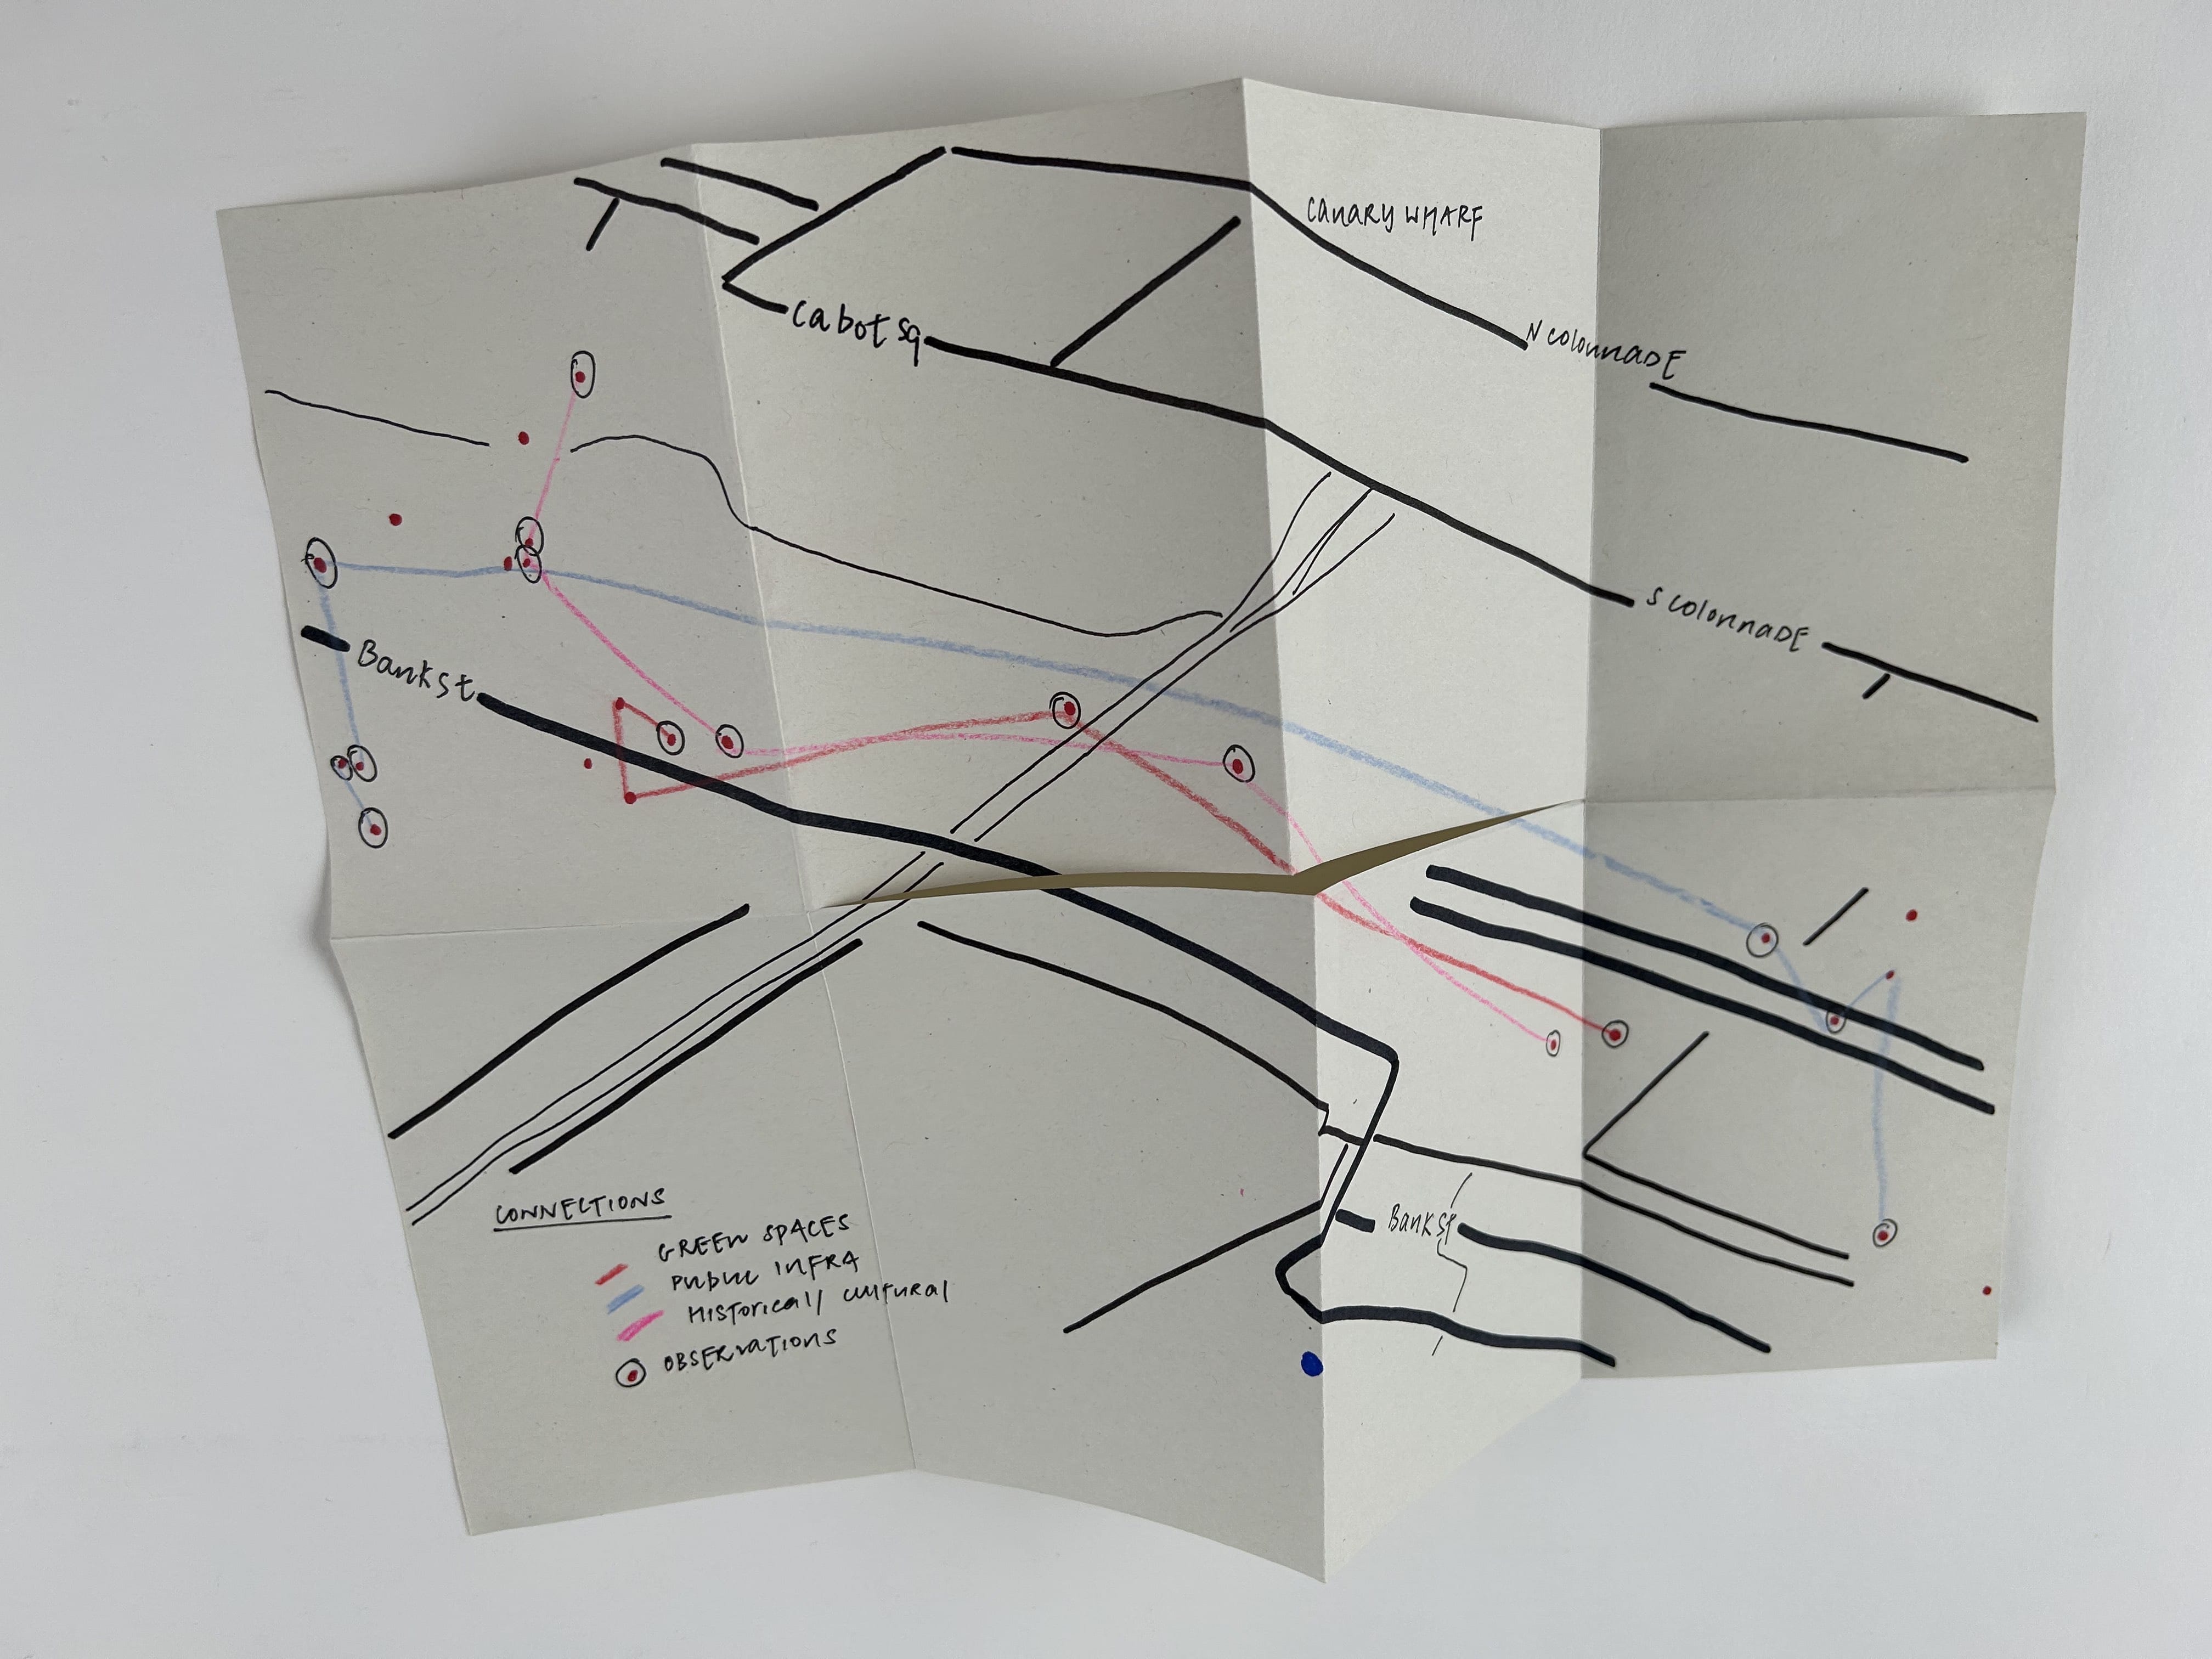
Views — Journeys, Connections & Typologies


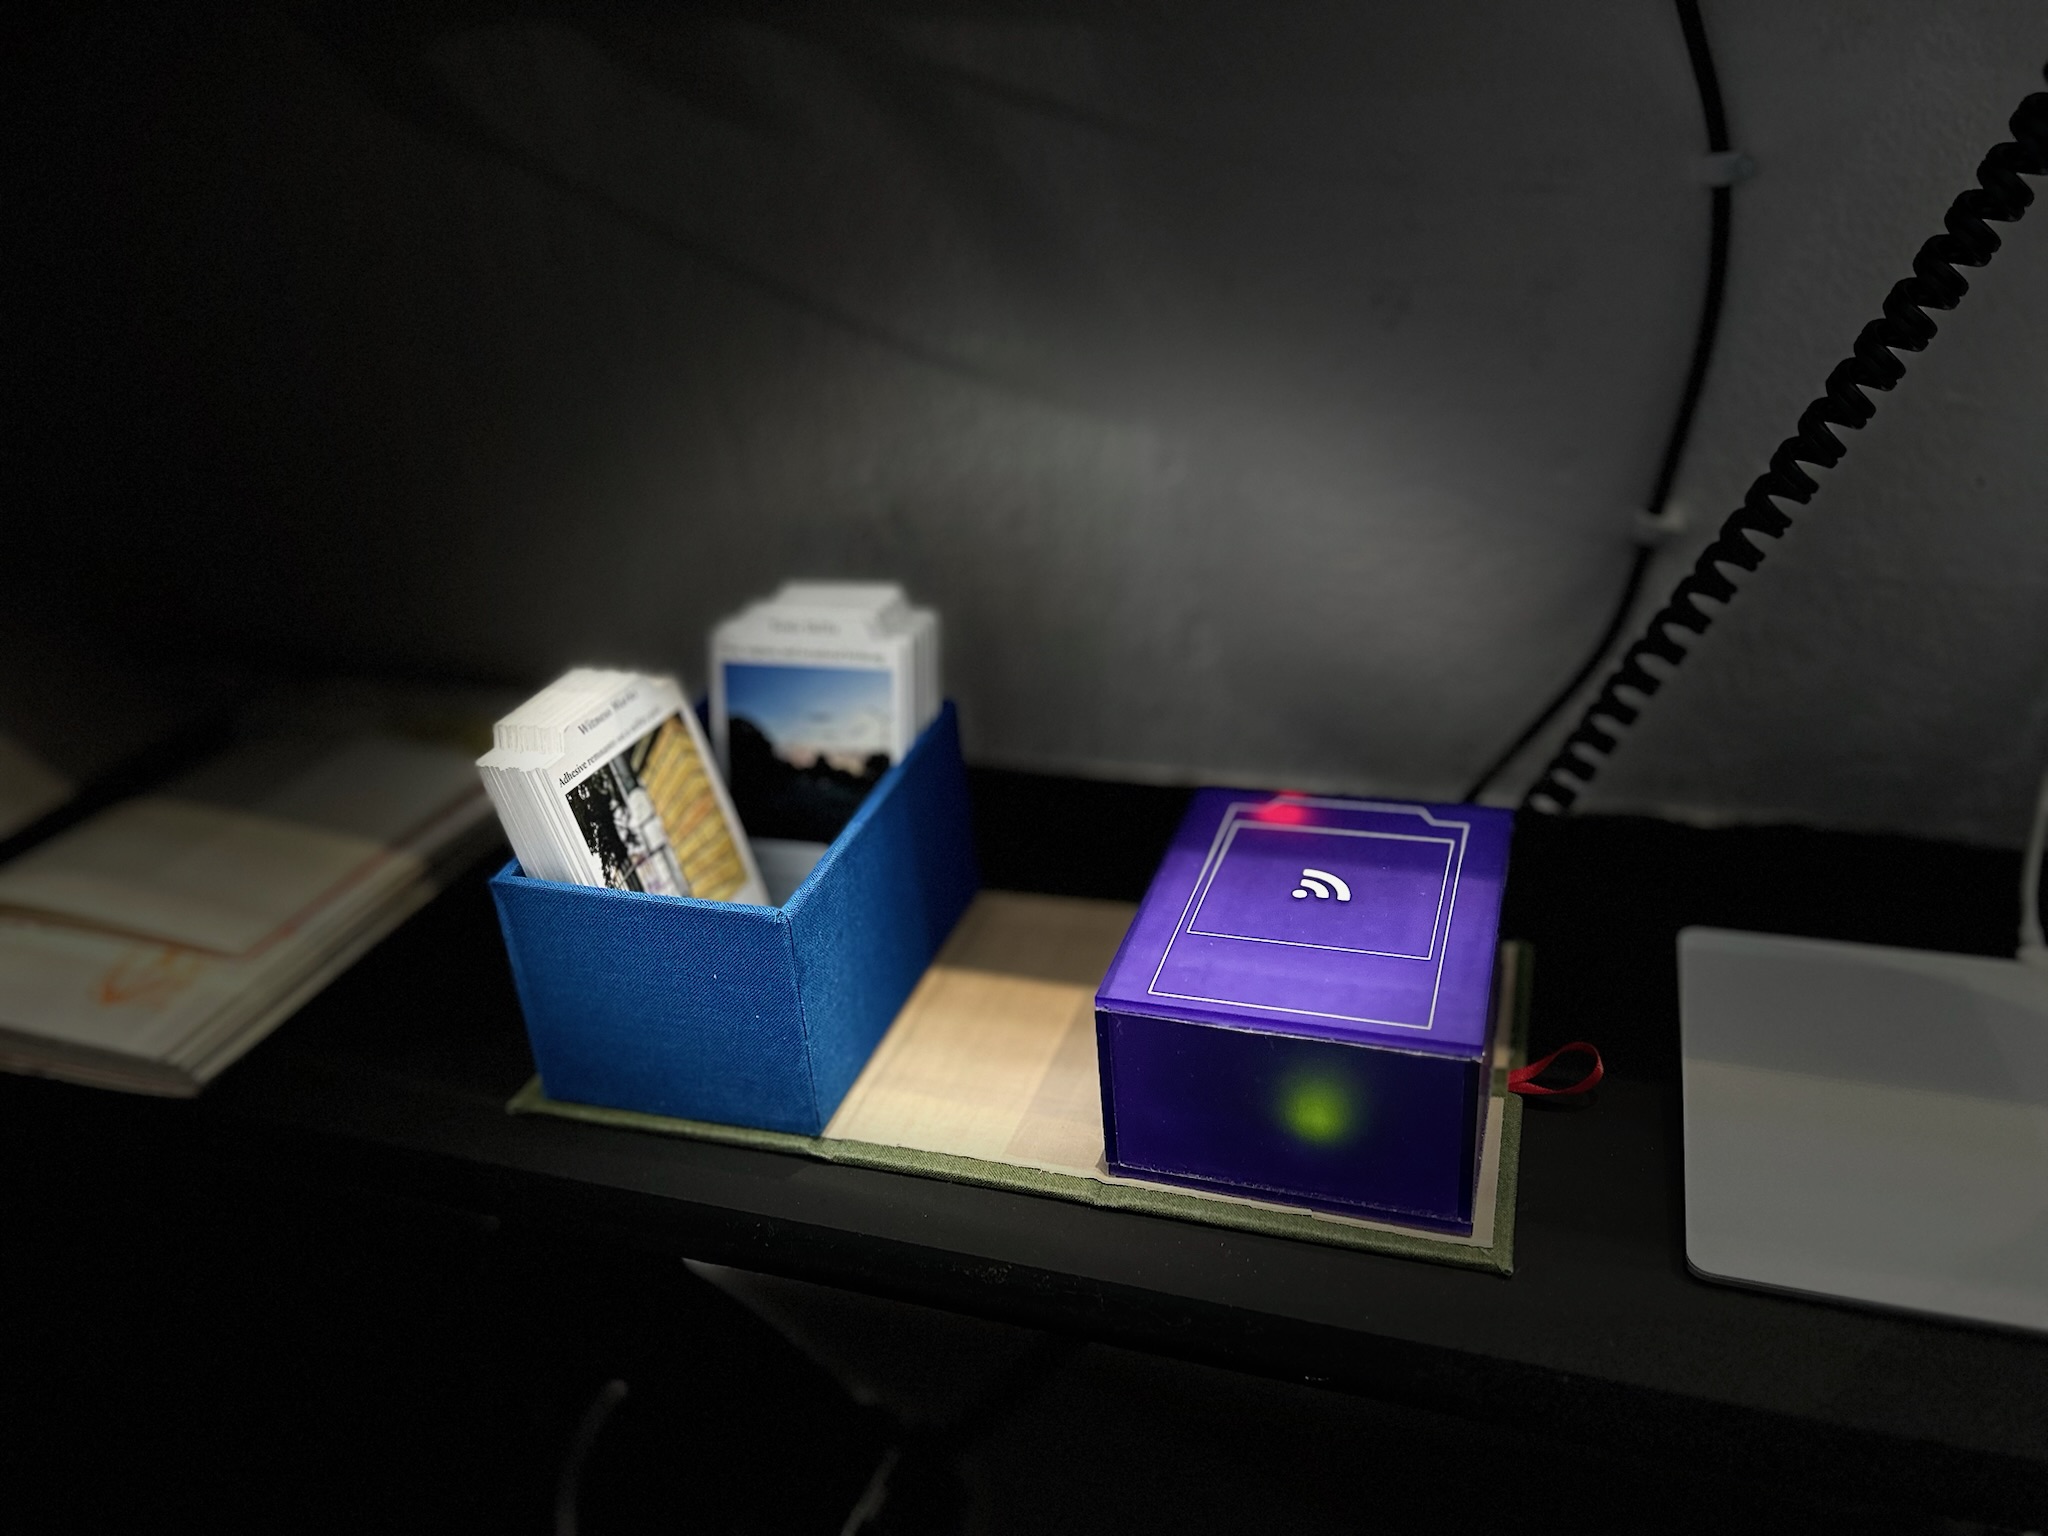
A Tangible Experience
To further augment the experience, I’ve integrated a tangible physical interface using Arduino and a RFID transceiver alongside the digital experience. Drawing inspiration from the analogy of a keepsake memory box, each card embodies a specific recollection. Tapping the card on a reader navigates the viewer to the associated data and interconnections on-screen. Through this gesture, I hint at the poetic interplay of the tangible and intangible in our sensory encounters.


Collaborators
- Concept, design & prototyping: Priti Pandurangan
- Web development: Ajith Ranka
Response
...there is something genuinely gorgeous about the way in which these disparate little datapoints and observations are weaved together into a strange sort of narrative of the physical.
- 2024 · Presented at DataFest Tbilisi
- 2024 · Presented at the Fourth World Congress of Psychogeography (4WCoP) in Canterbury
- 2024 · Presented at the Communicating Complexity Conference in Barcelona
- 2024 · Featured in Rows & Columns newsletter curated by Applied Works
- 2024 · Won gold in the Data2Speak Awards under data art & storytelling category
- 2024 · Presented at the Eurasian Dataviz Conference
- 2024 · Featured in Issue I of the Visualising Data newsletter curated by Andy Kirk
- 2024 · Featured in the February issue of the Web Curios newsletter
- 2024 · Featured in the January issue of the Best of Data for Everyone newsletter curated by Infogr8
- 2023 · Won a honorable mention in the Pudding Cup
- 2023 · Exhibited at the University of the Arts London Graduate Showcase
- 2023 · Presented at the London Data Visualisation meetup